

The split in how freehold and condo markets are acting that I pointed out last month carried on into September. The normally sleepier months of July and August were making up for a lost spring, posting higher than normal sales due to "pent-up demand." Well September did the same with 416 sales transactions up 19% over the same month last year. If that sounds high, 905 sales were up 57% YoY, as lowrise housing is de riguer.
You'll find the full set of market charts (only excerpts are highlighted below) here on my website. Let's get at September...

Condo market still softening
I wrote at length last month about how condos were softening. Totally same story this month so I won't do it in as much detail. The big story here is the continued rise in active listings. The 5,914 condos (apartment and townhouse) available for sale at the end of September was a new record - for September (surpassing 5,553 in 2012 by 6.5%), and any month (surpassing 5,667 in July of 2012).
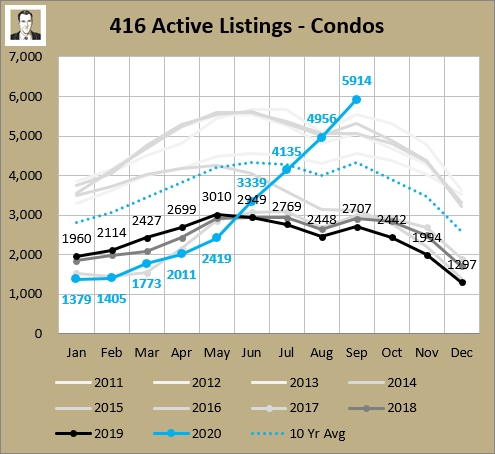
That's a lot of condos! Now I keep saying that those 5,000-plus you saw every September from 2012 to 2015 (average of the 4 years was 5,251) was more the normal and the last few years (2,707 in 2019) was the weird divergence. But we've blown past the old norms and are still climbing, so this is abnormal. Other point is that with more built condos and a higher population than there was in 2012, you would think the amount of active listings would have increased over time anyway.
The reason all this choice (for buyers) and competition (for sellers) is making the market soft is because the sales aren't rising in step. There were just 20 more condo transactions in September over August, but meanwhile 958 active listings were added over the month. So that's going to drive months of inventory (MOI) up, which indicates a softening market.
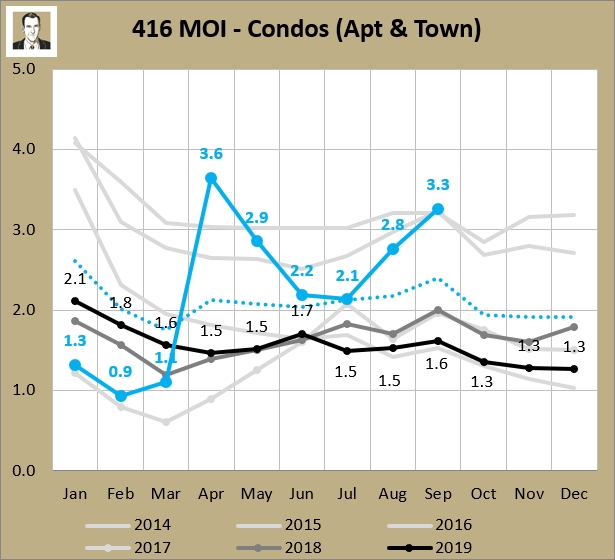
Remember with MOI, it's not just the absolute number that's important, but the rate of change as well. In the last two months it has shot up by 1.2 MOI. In the spring 2017 correction (bottom grey line) it rose by 1.5 MOI over 4 months, so even steeper.
Two different condo apartment markets - the core is shaken
And always note with averages you're going to have some things higher and lower. That's why I strip out 416 from the whole GTA numbers. But even within the 416, things aren't homogenous. The 3.3 MOI you see above for September is a mix of 3.5 for condo apartments (85% of September transactions) and 1.9 for condo townhouses (remaining 15%). If I look underneath that 3.50 for condo apartments, the 35 TRREB zones for the city (C01, C02, E09, etc.) range from 1.00 to 5.19. Here are the four highest in September:
1. C08 - 5.19 (745 active listings)
2. C02 - 5.07 (167)
3. C01 - 4.86 (1,474)
4. C09 - 4.83 (58)
C01 and C08 are prime downtown condo territory (south of Bloor, Duffering to DVP) and have nearly half of the city's listings (48.5% at end of September). And of course would have had the highest concentration of investors (pre-COVID it was great for people to rent downtown so they could walk to work or be right on subway line). But that's not so attractive right now so the rental market sucks and it appears a lot of investors are bailing (and also likely a lot less of them buying right now). And highest concentration of Airbnbs. C02 includes the Annex and Casa Loma and the average price for September sales was $1,557K. C09 is Rosedale-Moore Park and the average price there was $1,864K. MOI always goes up by price point and these are the two most expensive average condo price zones BY FAR (third places is C12 at $1080K, the only other one over a million). So that explains those two.
Anyway, takeaway is downtown core (C01 and C08) are doing a lot worse than the rest of the city, but are a big factor (34% of September sales, 46% of new listings, 48% of active listings). So that 3.50 MOI for 416 condo apartments is 4.96 in C1/C8 and 2.74 for the rest of the city. The sales to new listing ratio (SNLR) - which is a stat I don't like a lot because there's too much garbage in the "new listings" part of it - is 37% overall for the 416 (below 40% is said to be a buyer's market). But the non-core part of the city is right at 40% and C1/C8 is at a pretty shaky 24%.
A look at HPI
Remember the market peak of April 2017? Afterwhich detached prices took a big tumble? Well that was the last time the year-over-year (YoY) increase in detached prices was higher than condo apartments. Well they flip-flopped places in July after 38 months of condo apartments being on top (sometimes by a huge margin).
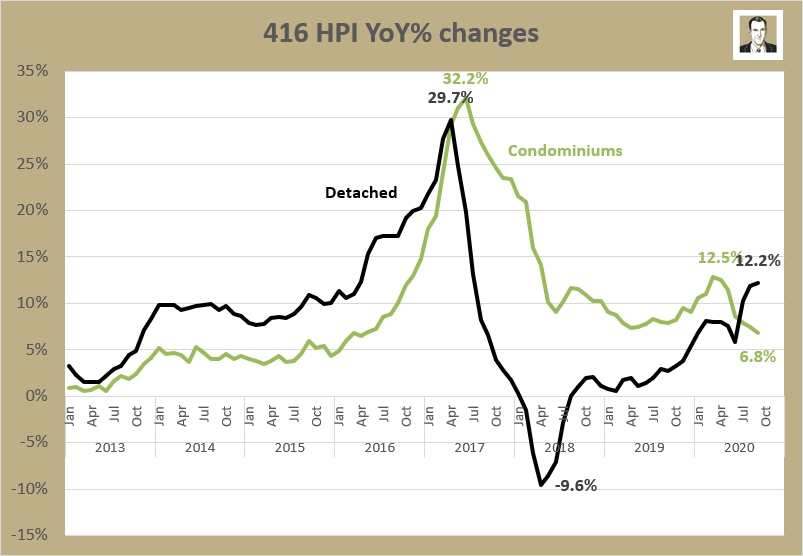
The condo apartment YoY figure of 6.8% is nothing to shake a stick at. If you could guarantee me 7% return on my investment portfolio for the next 20 years, or my house price appreciation, I'd take that in a minute. But it's the lowest figure since April 2016, or 53 months. The inevitable regression to the mean, IMO. I'm guessing the downward slope will contine for a several more months, and I think it's safe to say freeholds will remain higher than condos for a while also.
It's been really interesting to watch the rise of lowrise housing during a global pandemic. A lot of people have been talking about the "exodus to the suburbs" and "flight to detached" but single family attached (freehold semis and rowhouses) in the 416 have seen HPI rise $89K since the end of last year.
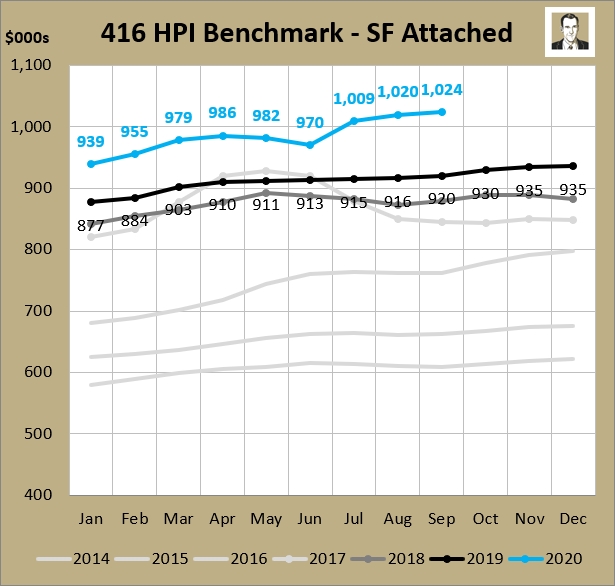
All 4 housing types that HPI has tracked have risen since the end of last year, partially aided by a hot market in the first 3 months of the year. Singe family detached is up $117K, condo townhouses are up $74K, and even condo apartments are up $29K - depite having declined $15K since their peak in May.
What will October bring?
For September, my guess was "continued strong freehold sales, and further weakening in condo prices as listings continue to climb." Sounds about right.
For October, the inventory will have to stop rising before things even think about stabilizing. The growth in listings is slowing, but they're still piling up.
While freeholds are still strong with a 1.5 MOI figure, that figure has been slowly rising from 1.2 in July to 1.4 in August to 1.5 now). The YoY sales growth is slowing which is telling me a lot of that pent-up demand has been satisfied. The SNLR has eased from 65% to 58% to 52% in the last 3 months so things are getting less hot and heavy and I'd suspect we'll be returning to more seasonal norms now. Of course, this could all change rapidly with a big second wave and whatever the governments throws at the wall against it. *shrug*
Again, the full set of charts are available here. Stay tuned and stay well.
About Scott Ingram CPA, CA, MBA
Would you like to make better-informed real estate decisions? I believe knowledge is power. For that reason I invest a lot of time researching and analyzing data and trends in the Toronto real estate market. My Chartered Accountant (CPA, CA) side also compels me to perform a lot more due diligence on properties my clients are interested in purchasing. If you have better information, you should have less risk and be in a position to make better decisions for your hundreds of thousands of dollars.
Your home is the single largest investment you'll make - trust it with an accountant.
Post a comment