

Are you curious which of the 144 TREB neighbourhoods are the most expensive? The least expensive? Yeah, me too, so I dug into it. You will find an interactive map at the bottom of the page, showing averaged detached prices for all neighbourhoods, but first...
A little background
First off, here are the most and least expensive neighbourhoods in 2018. I'll publish a companion post to this that shows which areas went up (and down) by the largest dollar amount and percentage; here's the 2018 version of that: 2018's biggest gainers and losers. And if you want to see what the landscape looked like in 2016, I actually broke that into a 3 part series with most and least expensive neighbourhoods, plus annual prices increases/decreases in each neighbourhood, and which hoods were quickest/slowest to sell.
The same as last time, I decided to only use detached house prices, to keep things more apples-to-apples across the city. Comparing average prices across the city—when one neighbourhood could be 90% condo apartments and 10% semis, and another has 100% detached houses—isn't quite fair. And some areas just have more attached housing types (e.g. rowhouses, townhouses, semi-detached) in the mix. Detached is far and away from the most prominent housing type in the city (has been between 70% to 72% of freehold transactions in each of the last four years) so it seems the most appropriate. Also when I say city, I am once again concentrating on just the City of Toronto (i.e. the 416 area code, or places where the postal code begins with M). I would also look at median prices if they were easily available since they're less influenced by extremely high or low sales, but the TREB data set I pull it from doesn't have medians so I use average prices. So let's get to it.
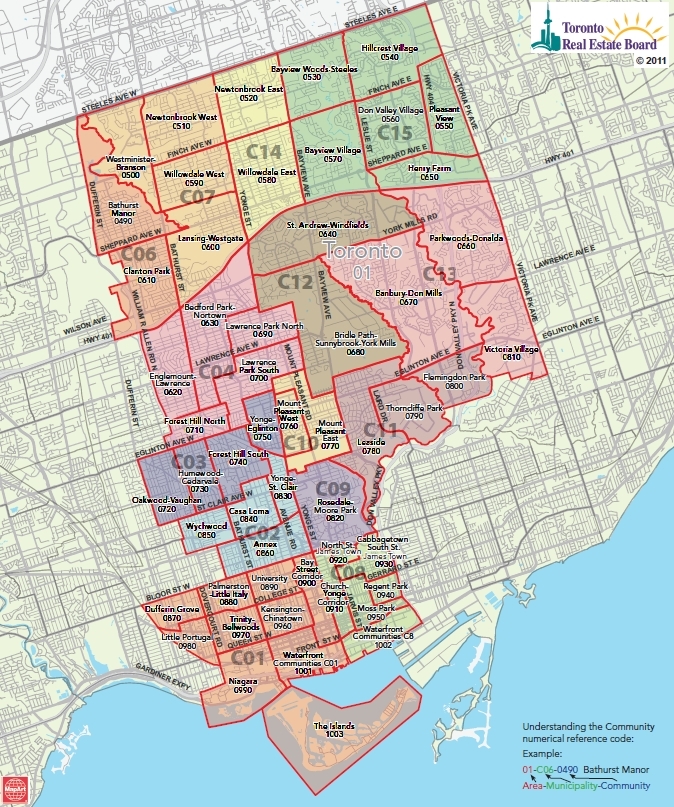
First, here's a map of the 35 TREB zones for Toronto:
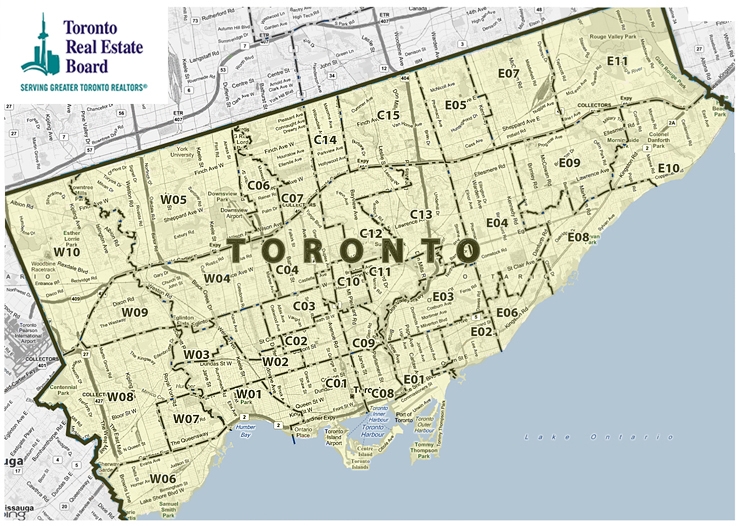
Within each of those zones, there are multiple "communities" in TREB's parlance, but which I'll call neighbourhoods (or hoods when I'm lazy). Here's how the 144 TREB neighbourhoods are distributed:
West: 10 zones / 49 neighbourhoods
Central: 14 zones / 54 neighbourhoods
East: 11 zones / 41 neighbourhoods
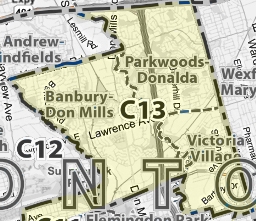
The above map is online here. To see a close-up of any of the zones to determine the boundaries of your own neighbourhood, just tick the communities box in the upper right and zoom in. This is what you see if you zoomed in on C13:
Some city-wide context
For context, here's how the 416 detached average price has progressed the last few years (with annual detached volumes in brackets):
2015: $1,047,400 (11,985)
2016: $1,252,300 (12,359)
2017: $1,421,000 (9,509)
2018: $1,321,800 (7,907)
2019: $1,319,000 (9,327)
There is a lot of noise in those last 5 years. You can see sales volumes rebounded in 2019 after a low in 2018. The crazy year was 2017, which you may remember was all hot and heavy for the first 4 months until the Ontario government brought in the Fair Housing Plan and that was enough to radically alter the psychology of the market. So detached volumes dropped in 2017 by 23%, but average prices for all transactions that year increased by 13.5% (driven by early-year transactions). Note all years are up from 2016 in price, but in 2019 prices remained flat - on average.
However, averages can hide a lot of movement beneath. There are a couple of different measures that show prices are moving upward.
- The MLS Home Price Index (HPI) single-family detached price for the City of Toronto, which was $1,097,400 for December 2018 and averaged $1,105K for the 12 months of 2018. For December 2019 it was up to $1,157,100.
- The median neighbourhood average price in 2018 (out of 127 neighbourhoods with at least 10 detached sales) was $1053K. In 2019 the median neighbourhood's average price rose to $1,110K (W06 Long Branch and E03 East York were in the middle of the 130 qualifying neighbourhoods.
- The amount of qualifying neighbourhoods with declining average prices is in the minority. In 2016 it was 2. In 2017 it was 1. In 2018 there were 84 neighbourhoods (66%). In 2019 there were 36 (28%), or 72% rose in average price.
Okay, now to the list...
The list: who is new and who is gone
Here are the 15 most expensive neighbourhoods for average sold price in 2019. Last year all 15 were in central zones by TREB's definition (throughout this I will use blue for central, red for the west, and yellow for east). I'm using top 15 lists as there are 144 official TREB neighbourhoods so that's about the top 10%.
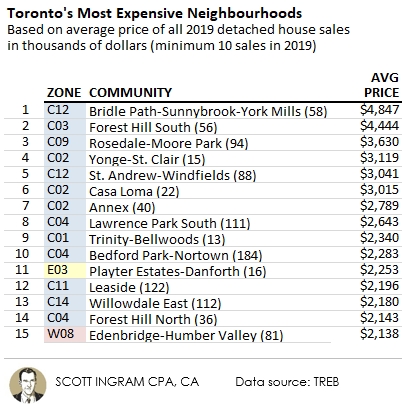
A note about the numbers in brackets beside the hood name. That's the number of transactions during 2019. So hoods like Trinity Bellwoods (13 sales) and Playter Estates-Danforth (16 sales) may not be as solid a number as a place with 100 sales. A few high-priced sales can greatly swing an average.
Speaking of E03 Playter Estates-Danforth, it's one of two new entries to the list this year, and the highest-priced neighbourhood in the east. The other new entry, W08 Edenbridge-Humber Valley, is the highest-priced neighbourhood in the west. In 2018 the entire top 15 was in central neighbourhoods. Falling out of the top 15 were C15 Bayview Village (#16), down from #8 and C13 Banbury-Don Mills (#21), down frome #13 last year and as high as #8 back in 2016. Those two neighbourhoods near the 401 grew a lot in the speculative boom in 2016 and 2017, only to slide back in the last couple of years.
Bridle Path retains the Most Expensive Neighbourhood crown ![]()

At the top of the list above you'll find Bridle Path-Sunnybrook-York Mills (BPSYM). Ho-hum. Each year I've looked at this since 2016 it has been #1, with Forest Hill South coming in at #2. The average for 2019 of $4,847K was up a whopping $514K from $4,469K, which was pulled upward by a lot of very high-end stuff, including four sales between $11 and $12 million last year. But even the median rose from $3,990K in 2018 to $4,300K last year.
I've also got to point out a couple of things here. First, as you may suspect given BPSYM's long name, the actual "Bridle Path" (outlined in yellow below) makes up just a portion of the zone. And just a portion of the sales (7 of the 58). These 7 sold for over $50 million combined (average $7,182K) and bring up the whole BPSYM neighbourhood average, as you'd guess.
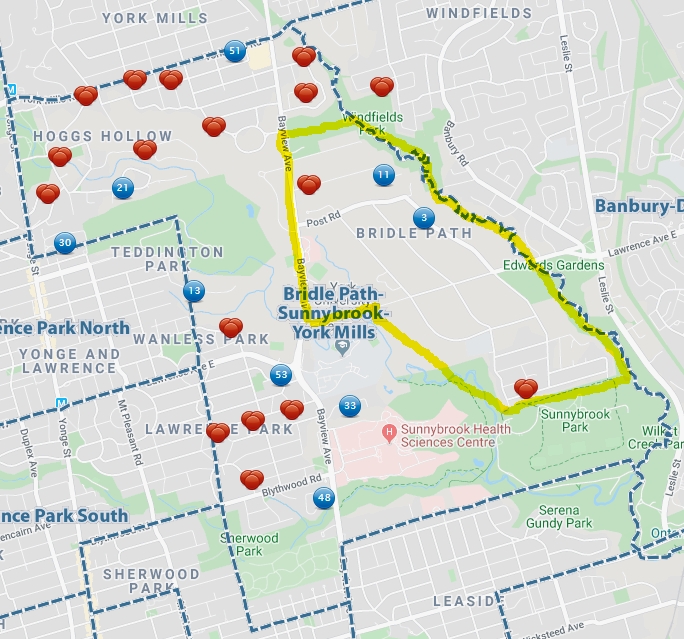
The other thing I wanted to point out is, you see those three red dots just northeast of the yellow Bridle Path zone? Well because some clown classified them as BPSYM when the were clearly not. Agents do this for cachet purposes, but it leads to incorrect information in the TREB stats. Ye olde garbage-in, garbage-out. Every property requires an address to be input. TREB should take the neighbourhood classifying out of the agent's hands and make it automatically generated from the address.
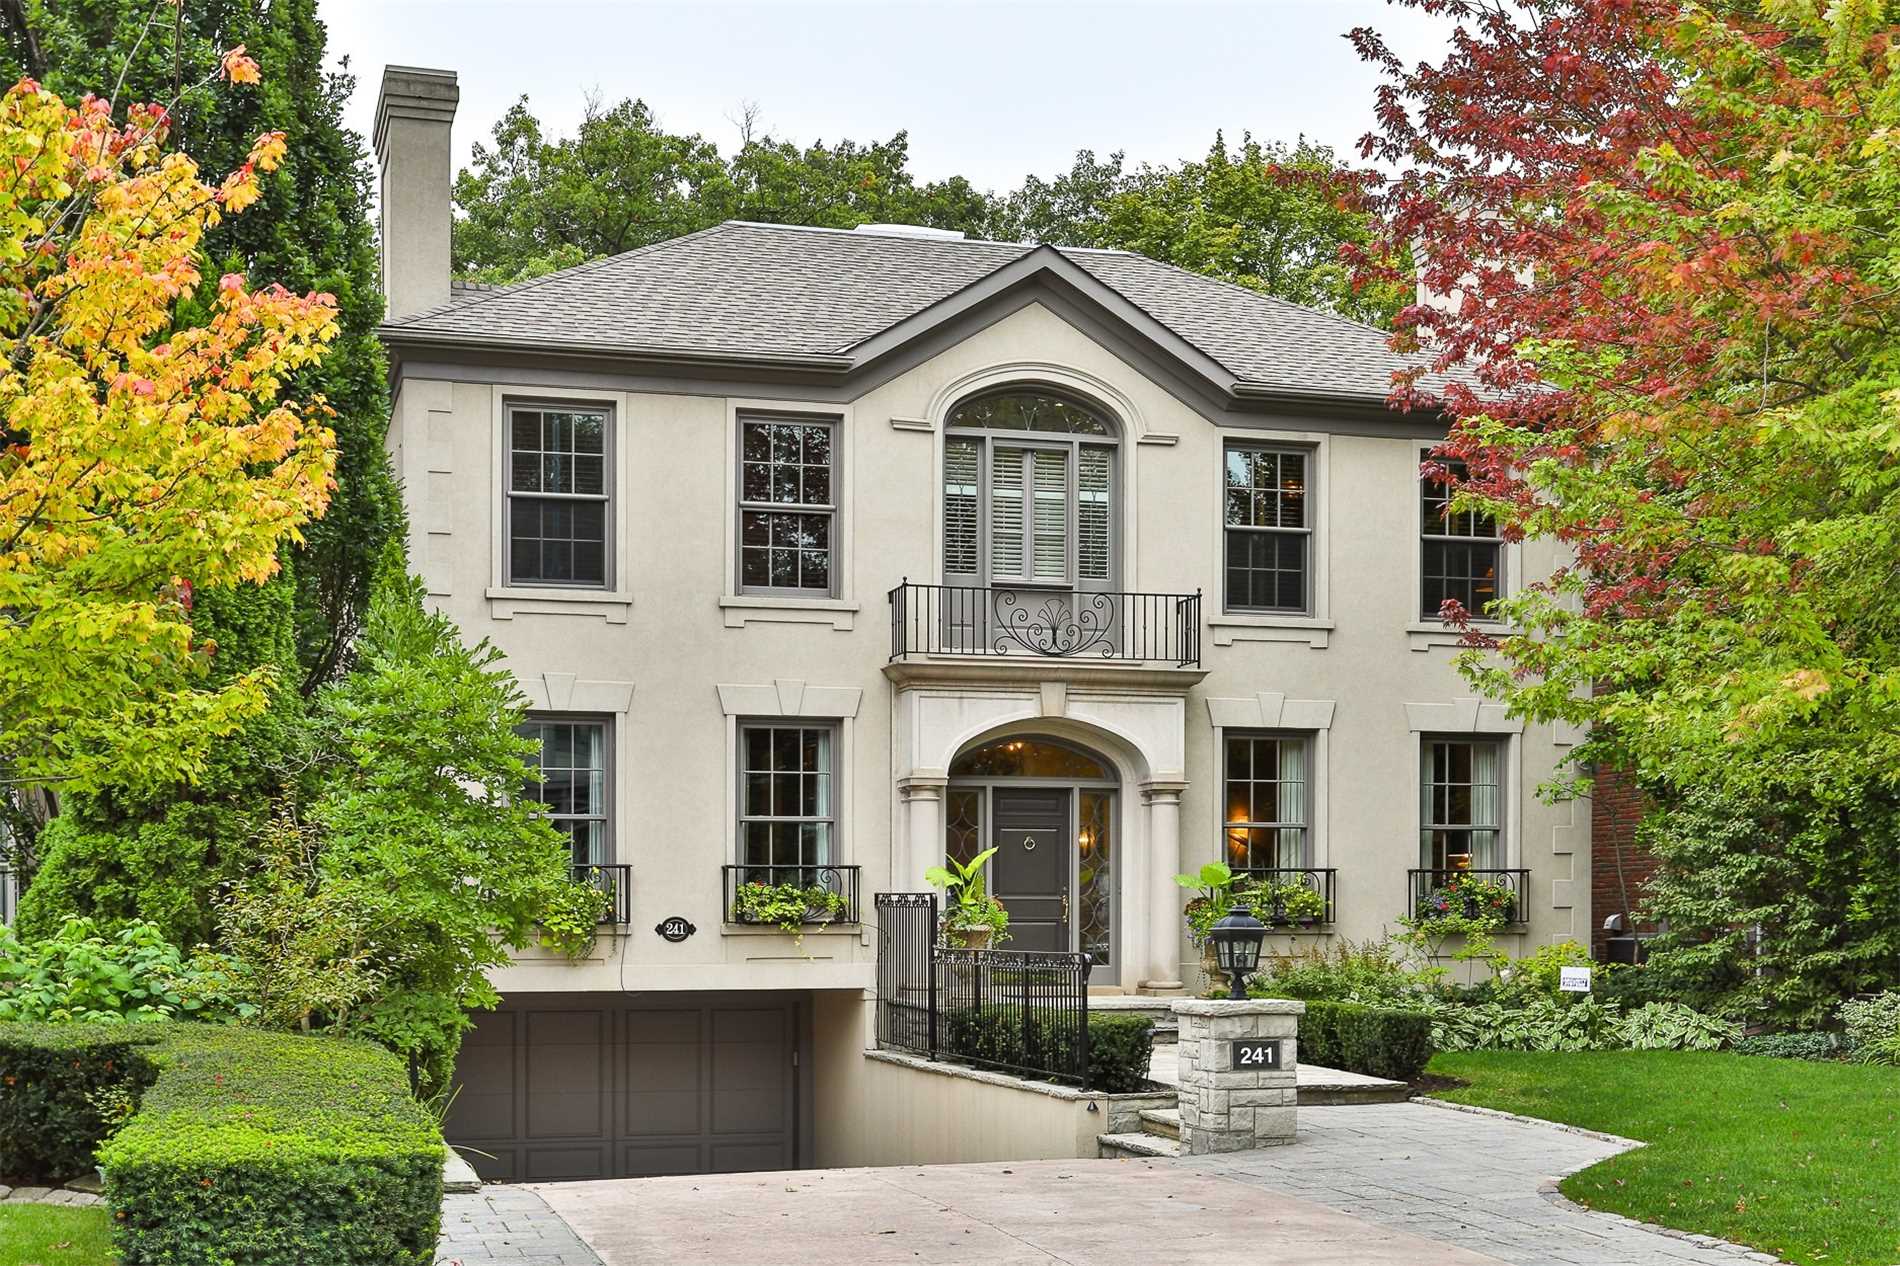
So what does an average-priced detached home in BPSYM in 2019 look like? Well this "Testimony To Timeless Elegance & The Utmost In Luxury Finishes & Design" house with 4+1 bedrooms (+1 means it's below-grade) and 6 bathrooms on a 50' x 171' lot sold for within $40K of the hood's $4,847K average price. It really has a lot of nice mature trees.
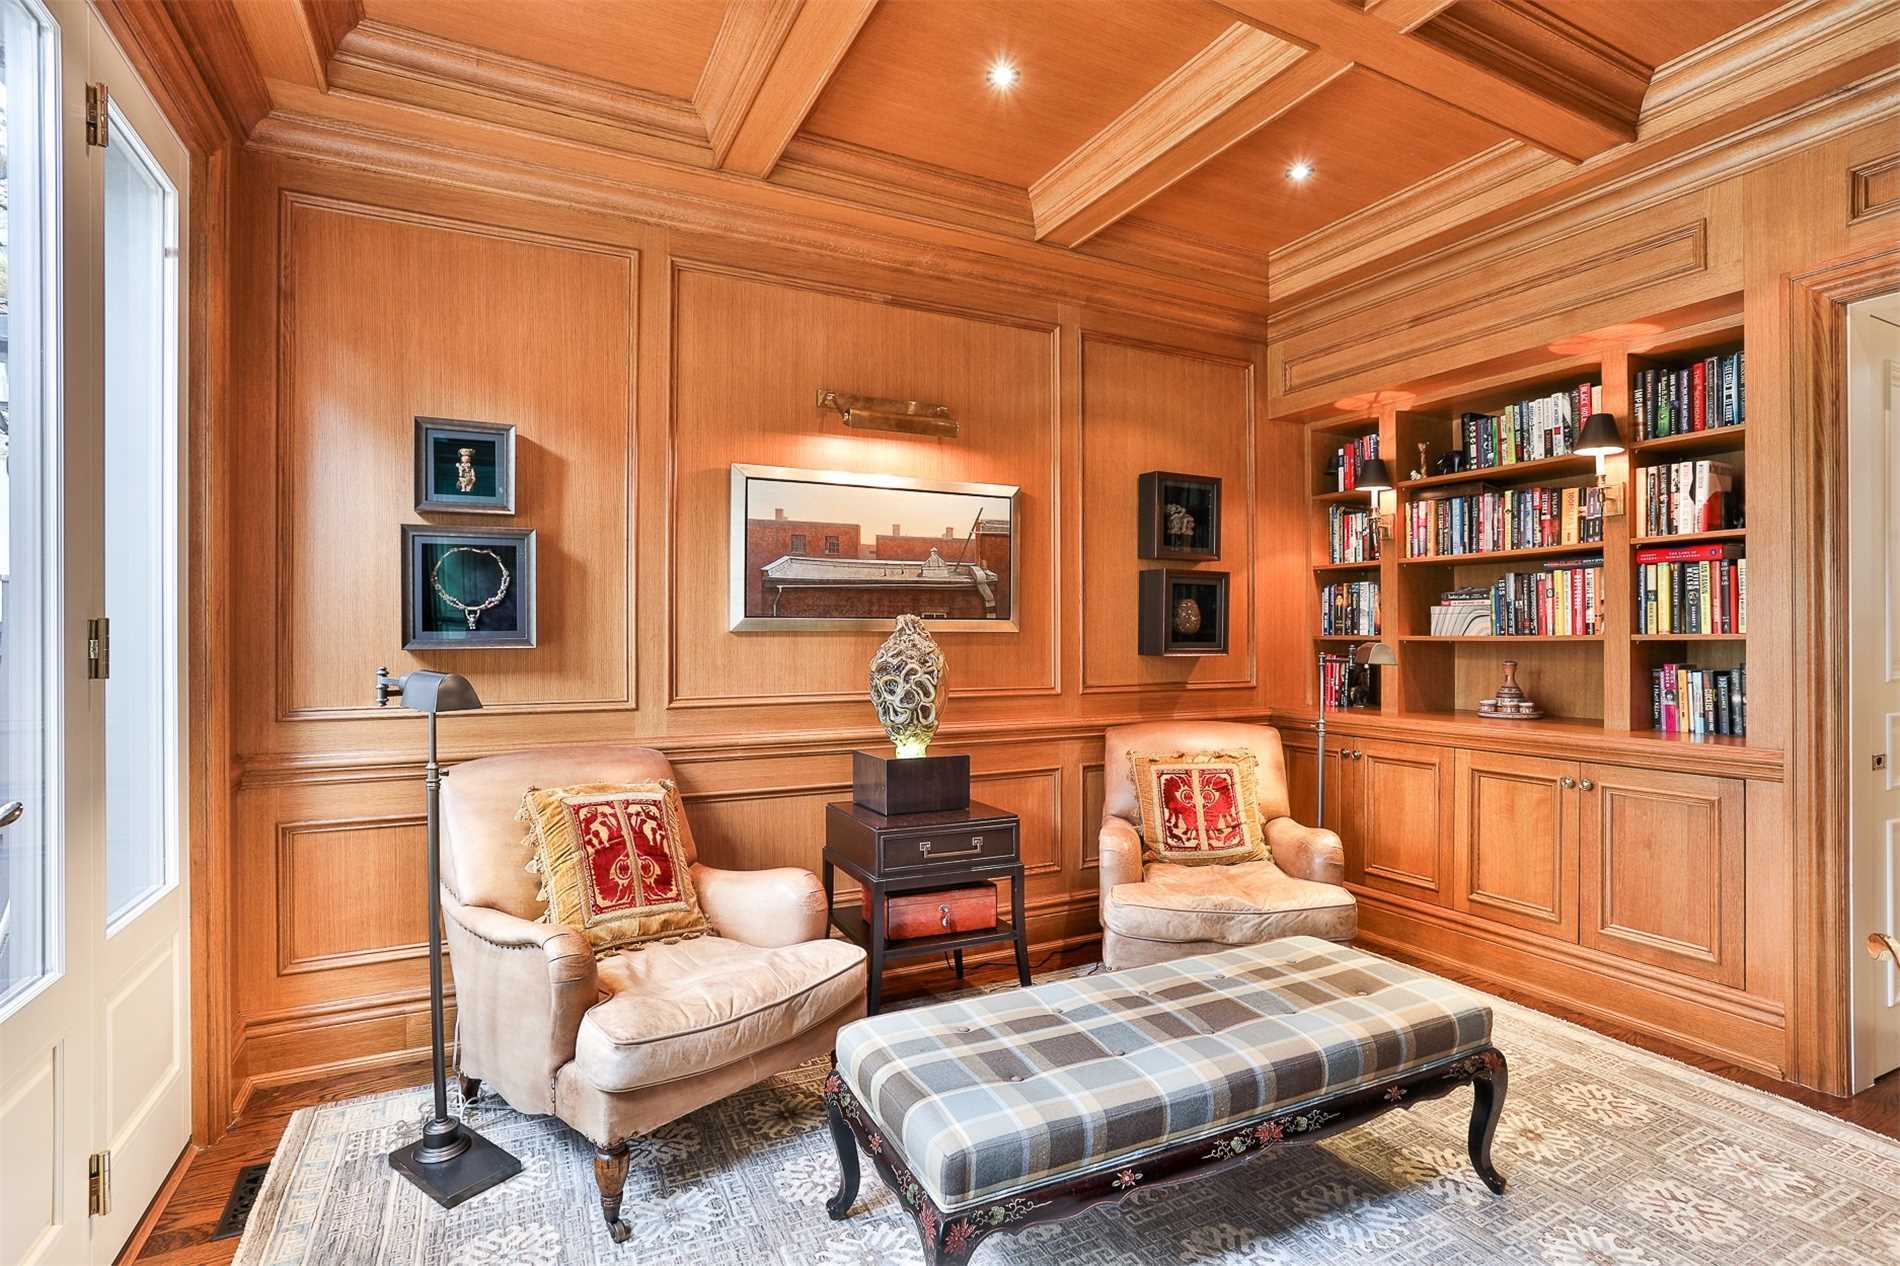
It has a library:
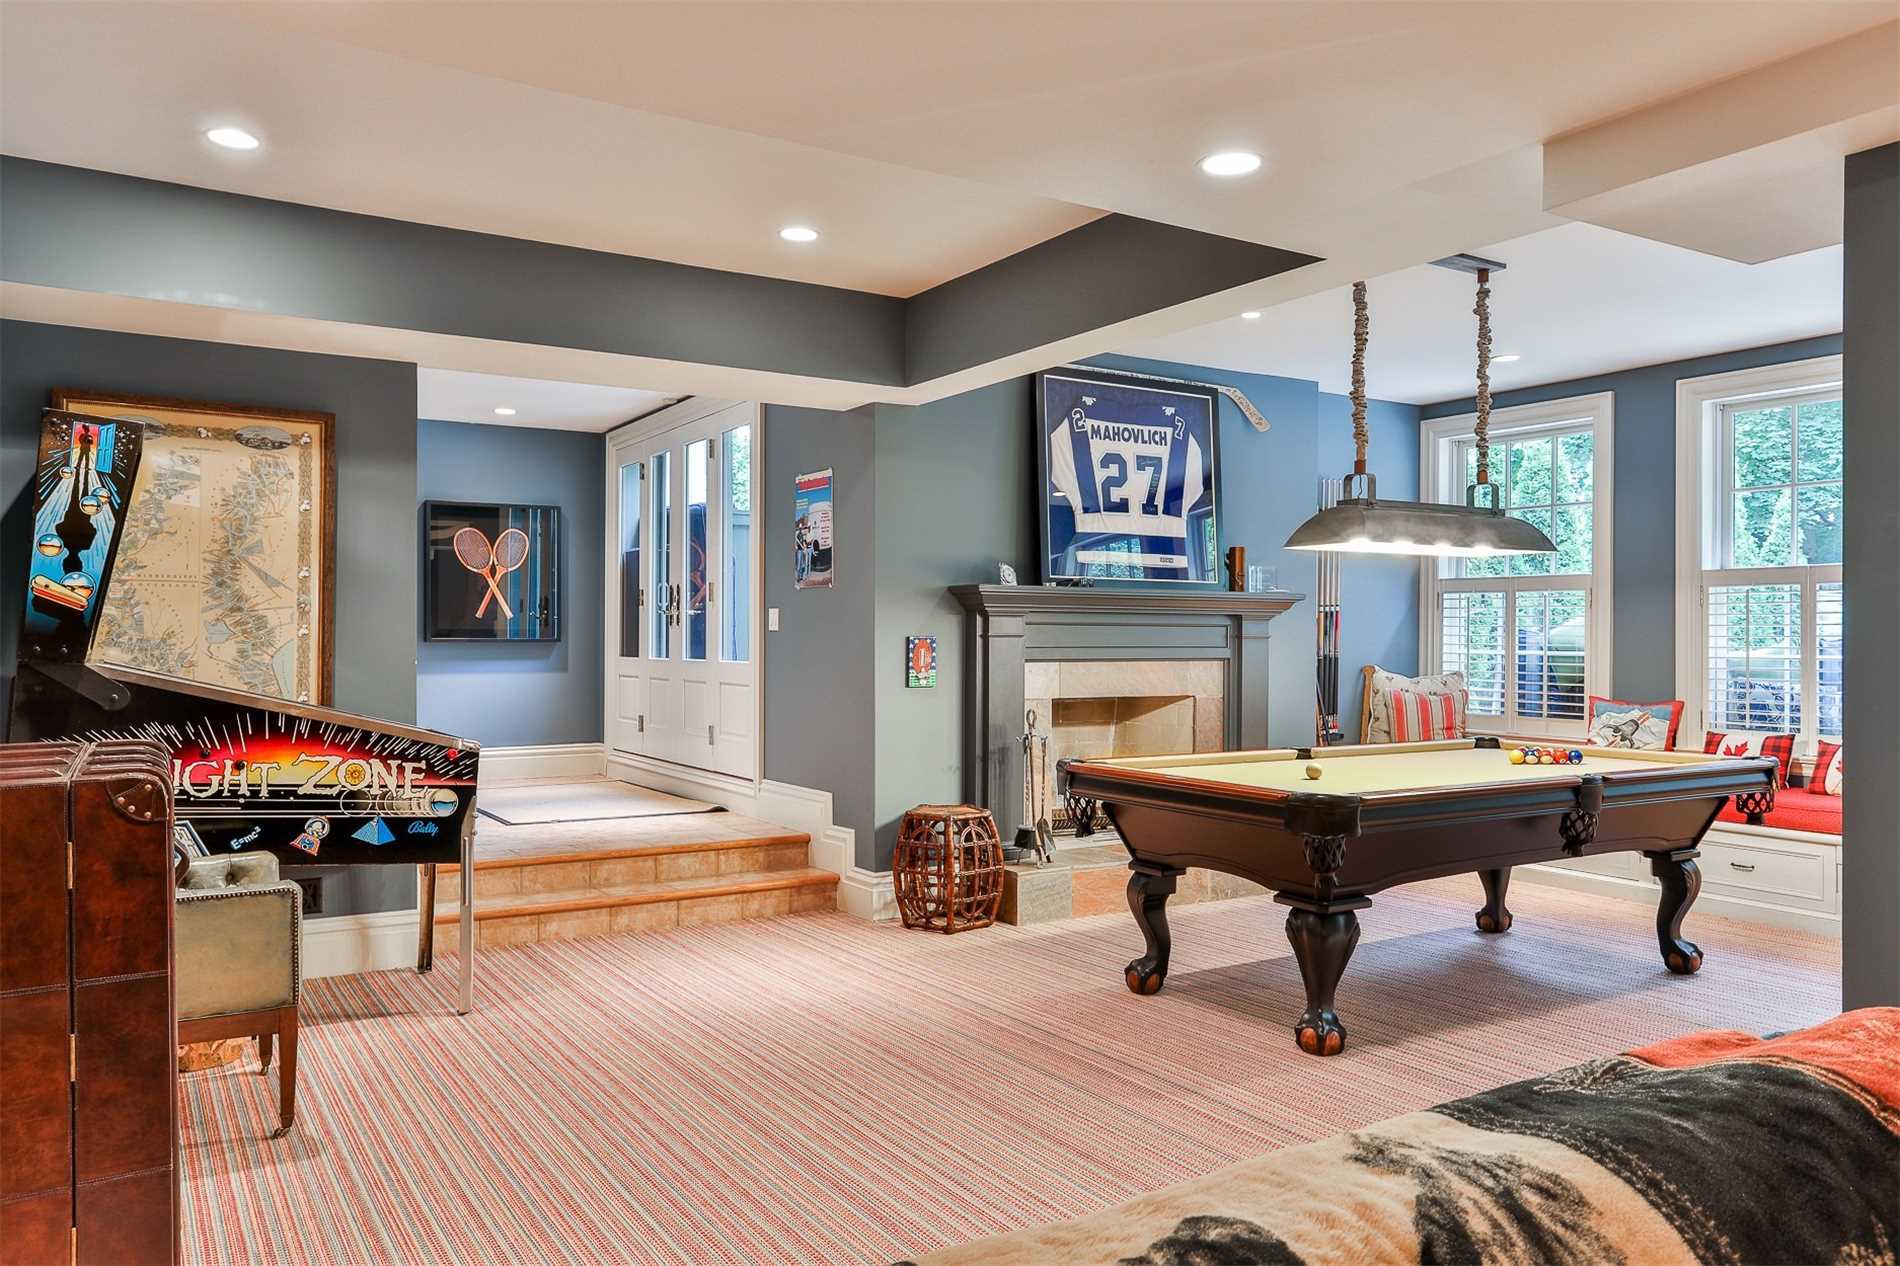
A games room:
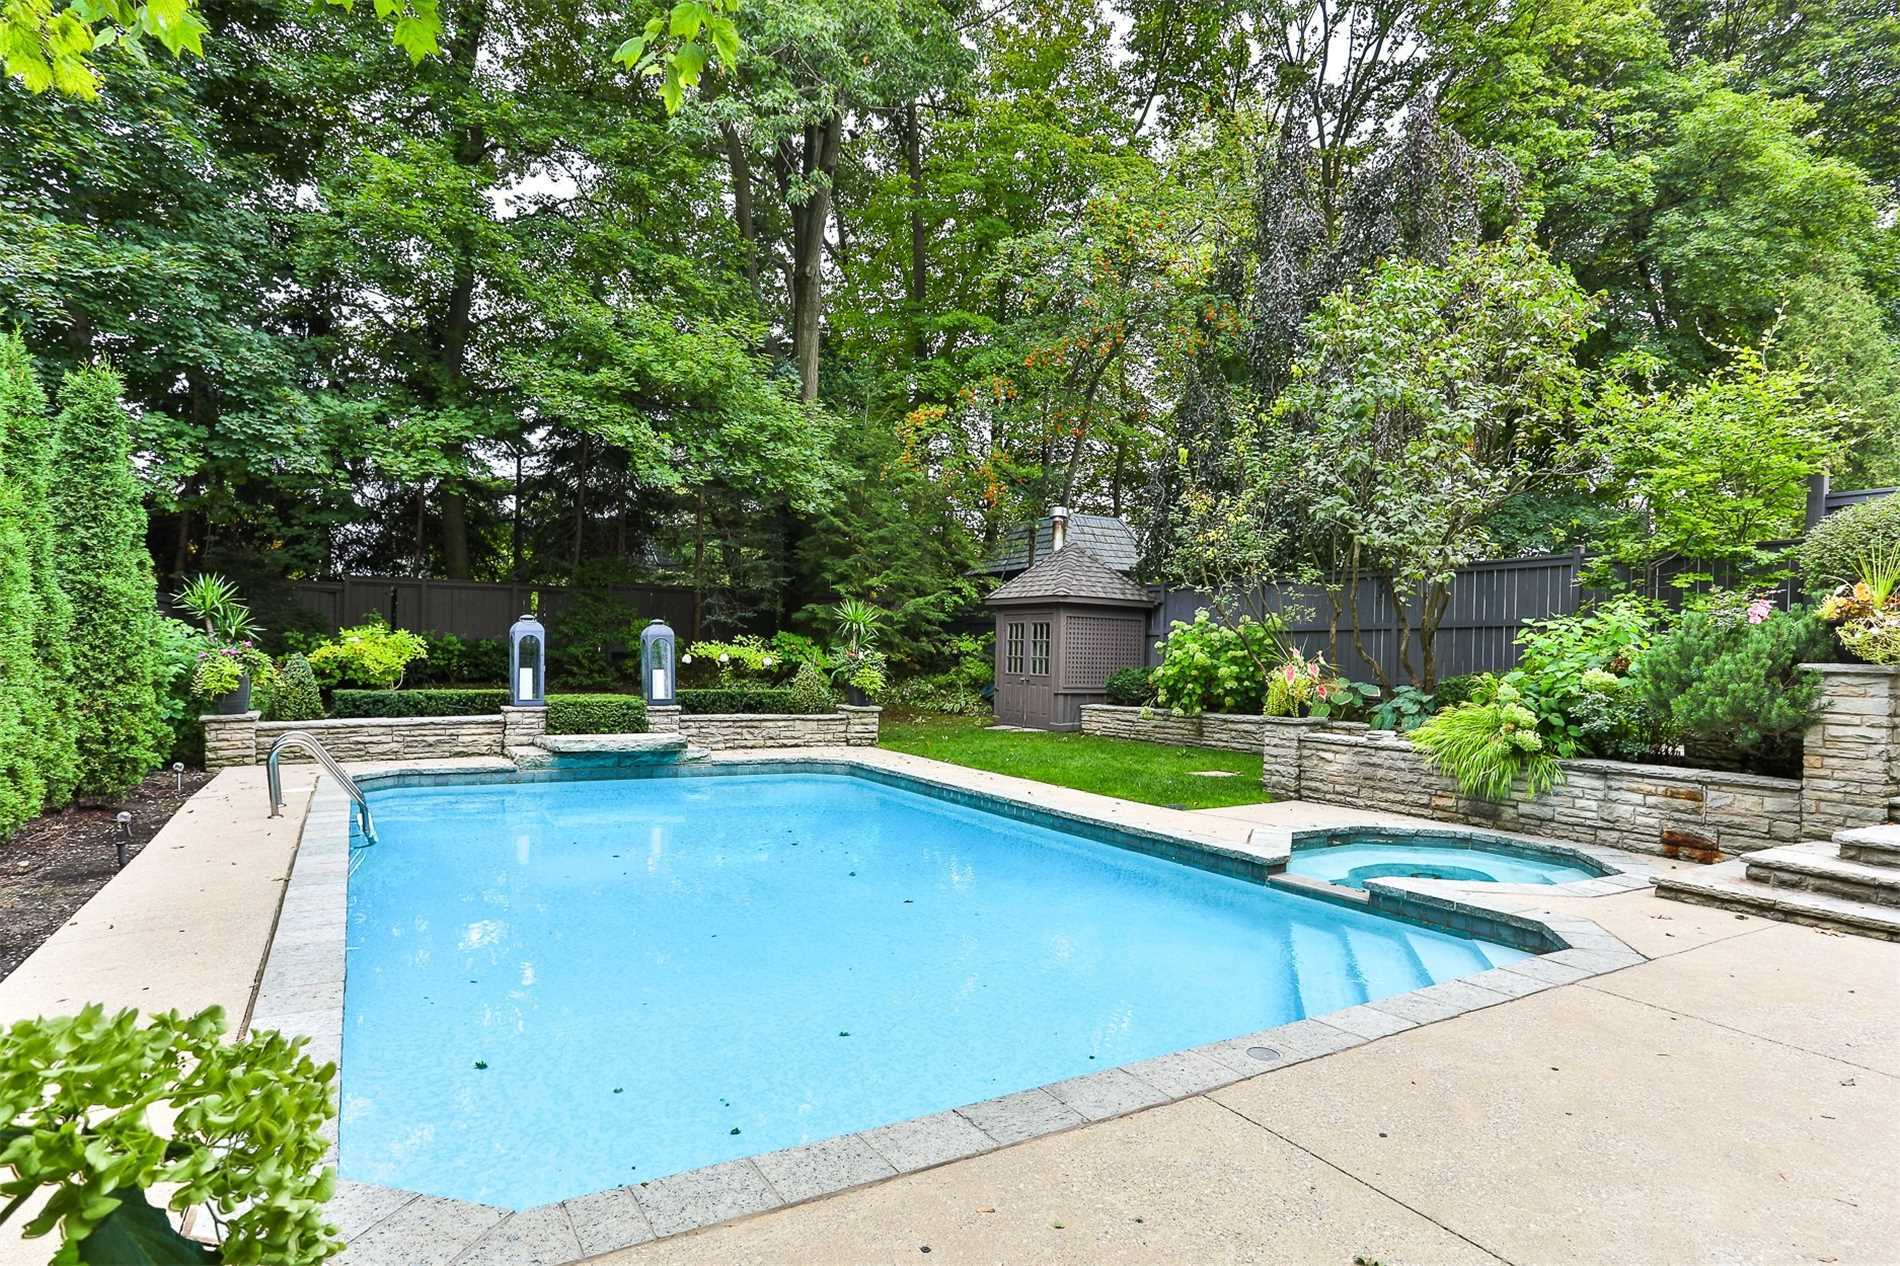
And a pool, naturally:
More central, more expensive
Once again the central neighbourhoods dominatead the 15 most expensive neighbourhoods, with 13 placements. As you see below, the centre regions are more or less bounded by Dufferin on the west and Victoria Park or the DVP on the east.
Going further down the list, 20 of the top 23 are in the central areas. Furthermore, only 2 central neighbourhoods are below the median: C3 Oakwood Vaughan (again, #74 this year) and C13 Victoria Village (was above last year, #69 this year). Not coincidentally those border the west and east regions respectively. This preference for the central zones is pretty evident on the chart below:
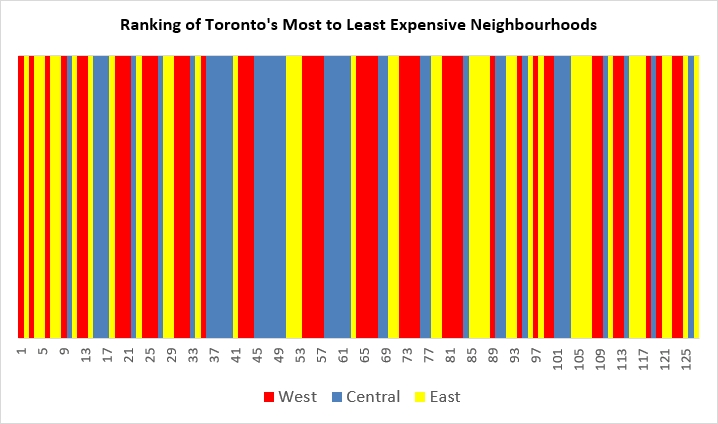
My hypothesis is people like being closer to the core and so prices will radiate from there (the same house 30 minutes east of King and Bay will be more expensive than 60 minutes east, which in turn will be more expensive than one 90 minutes east). The wrinkle is that rich people also like big-ass houses with big-ass garages for their dozen luxury automobiles, and big yards to play croquet on. So that's why the Bridle Path properties are more expensive than downtown because you get much bigger lots. Secondly, people like being close to the subway and 12 of the 14 central zones are on the Yonge-University subway line. Yonge Street runs pretty much up the middle of the central zones. If you like to drive downtown instead, the DVP is on the eastern edge of the central zones (including the 2 that don't have subway access), and Allen Road is on the western edge of the central zones.
Mount Dennis defends its Least Expensive title ![]()

It's interesting to look back and see as recently as 2015 the number of neighbourhoods with detached houses averaging $750K or less (54) was about the same as the number of million-dollar neighbourhoods (52). In 2018 that was down to 13 $750K neighbourhoods and in 2019 that dropped all the way down to 4 neighbourhoods under three-quarters of a million dollars. There are now about as many $2 million neighbourhoods (19) as there are neighbourhoods under $800K (18), which is just outside the 15 least expensive neighbourhoods list.
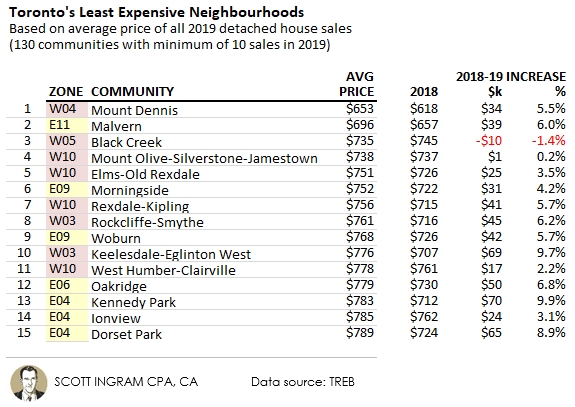
I added some columns to show the 2018 prices for these 15 neighbourhoods. You'll notice all but one increased in price. That's 93% of neighbourhoods up, while the full list of 130 was 72% up. Additionally 10 of the 15 (67%) had a percentage price increase higher than the 4.1% median neighbourhood increase. That's showing that there's a lot of pressure on the low end of the market, which is consistent with lower months of inventory (MOI) figures I always see when I pull those stats by price point. It's also consistent with what I've seen when my clients have been interested in homes in these less-expensive areas. For example, 44% of freehold sales in Mount Dennis in 2019 sold for over the asking price, compared to 37% city-wide.
Another thing I noticed is that all of these neighbourhoods (except for E06 Oakridge) are north of St. Clair Avenue. It was the exact same story last year.
Let's talk about W4 Mount Dennis ($653K average, up from $618K). It has been the least expensive neighbourhood in each of the last four years I've been looking at this. It's is bordered by the railway tracks running diagonally on its east side roughly parallel to Weston Rd, reaches a little bit south of Eglinton on the south, and has the Humber River as its western boundary with Jane Street running north/south through the middle of it. It has long had a blue collar vibe, as it grew up around the now shuttered Kodak plant. The westernmost terminus of the Eglinton Crosstown LRT is on its edge (which is planned to be a big transit hub including a stop on the Kitchener GO Transit line), and personally think this area has a good upside because of that. Heck this article from 2012 says the same thing.
Demographically, according to the City of Toronto's 2016 Neighbourhood Profile on Mount Dennis, you can see the blue collar-ness, with only 18.3% of residents holding a bachelor's degree, compared to 44.1% for the city as a whole. The median household income is below the City's median, and more residents receive government transfers and are below the poverty line.
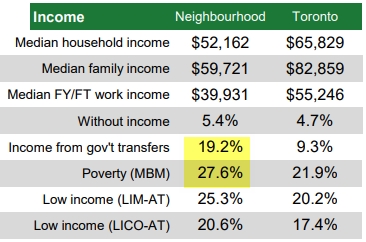
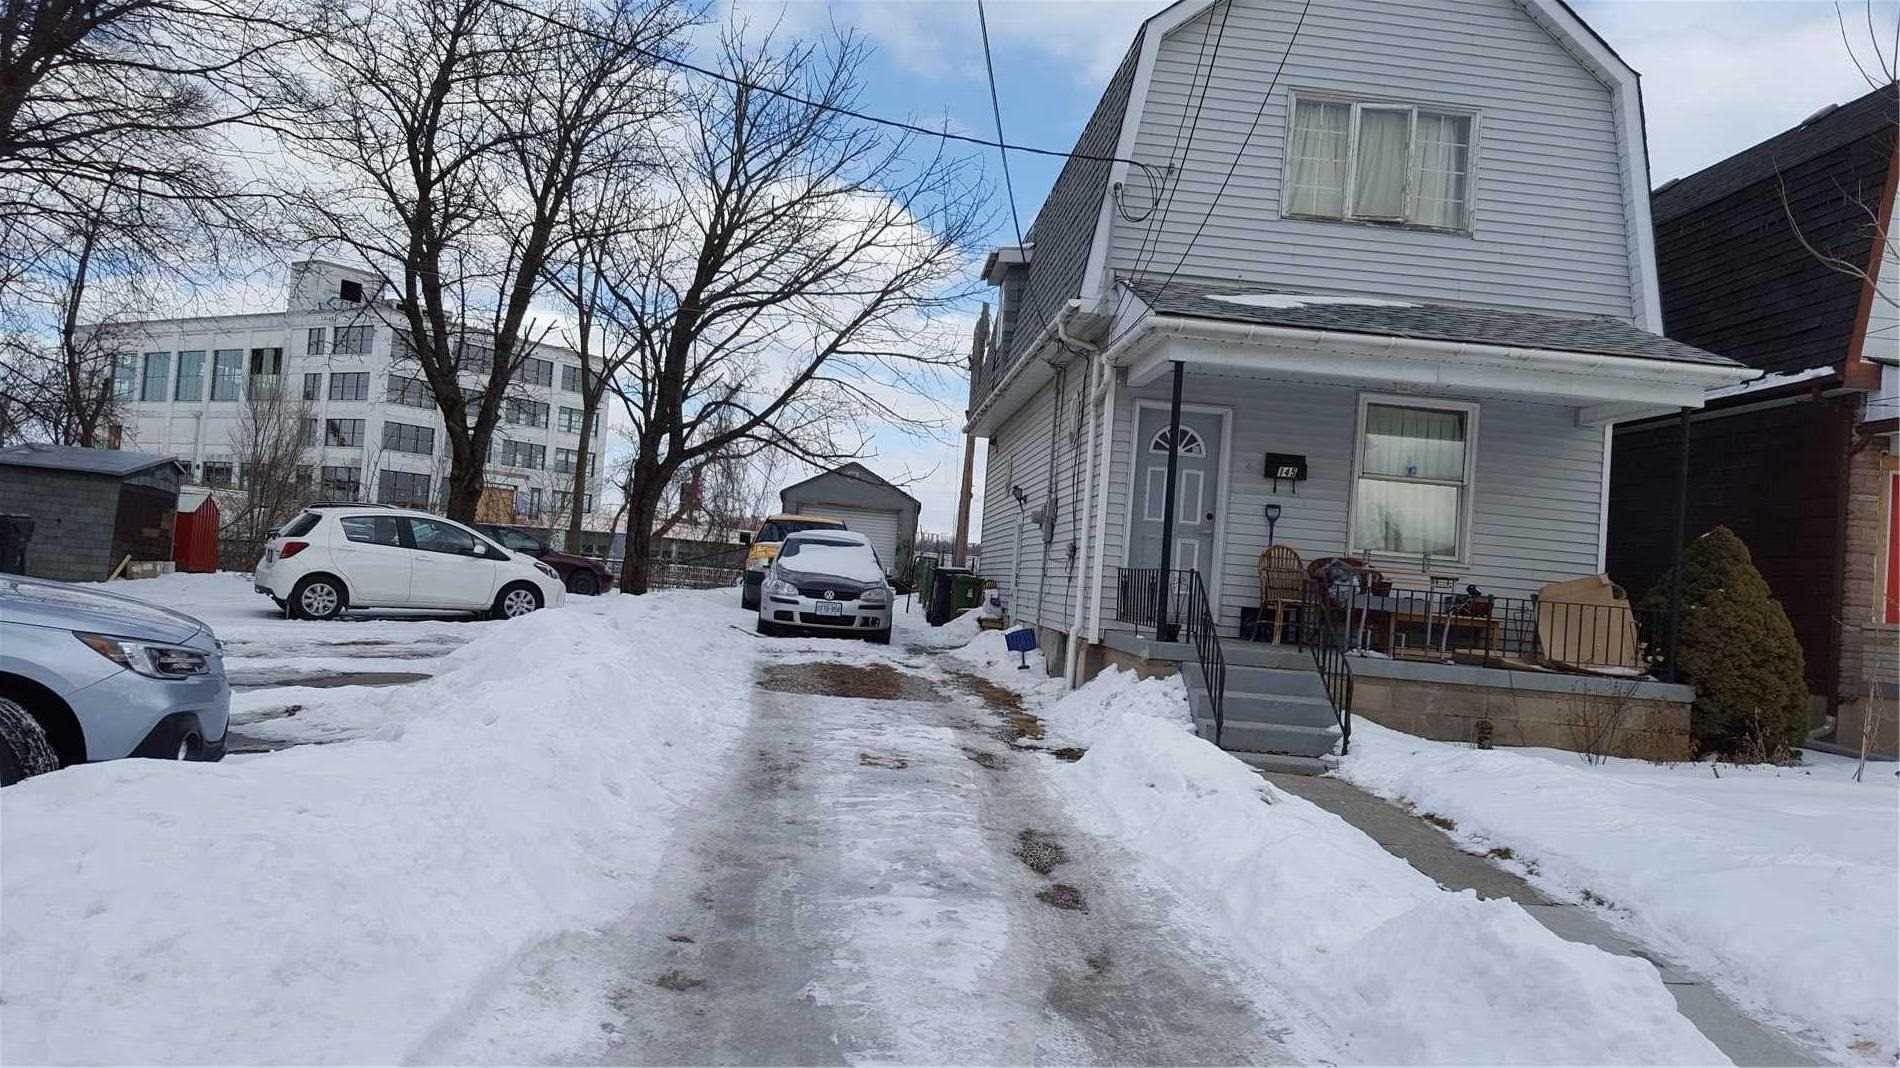
Yet the average detached home costs $653K here now, or almost 11 times that median family income (granted the income is from 2016 but even if it grew 2% a year it's only $64,644 so about 1/10 of the house price). Here's an example of average-priced detached home from 2019. This is two-storeys on a 25' x 98' lot with 4 bedrooms and 2 bedrooms upstairs, with a one bedroom basement apartment. As you can kind of figure from the picture, it backs right onto the tracks. It's really close to Weston Rd and Eglinton, so really close to the Mount Dennis Eglinton Crosstown LRT station I mentioned above.
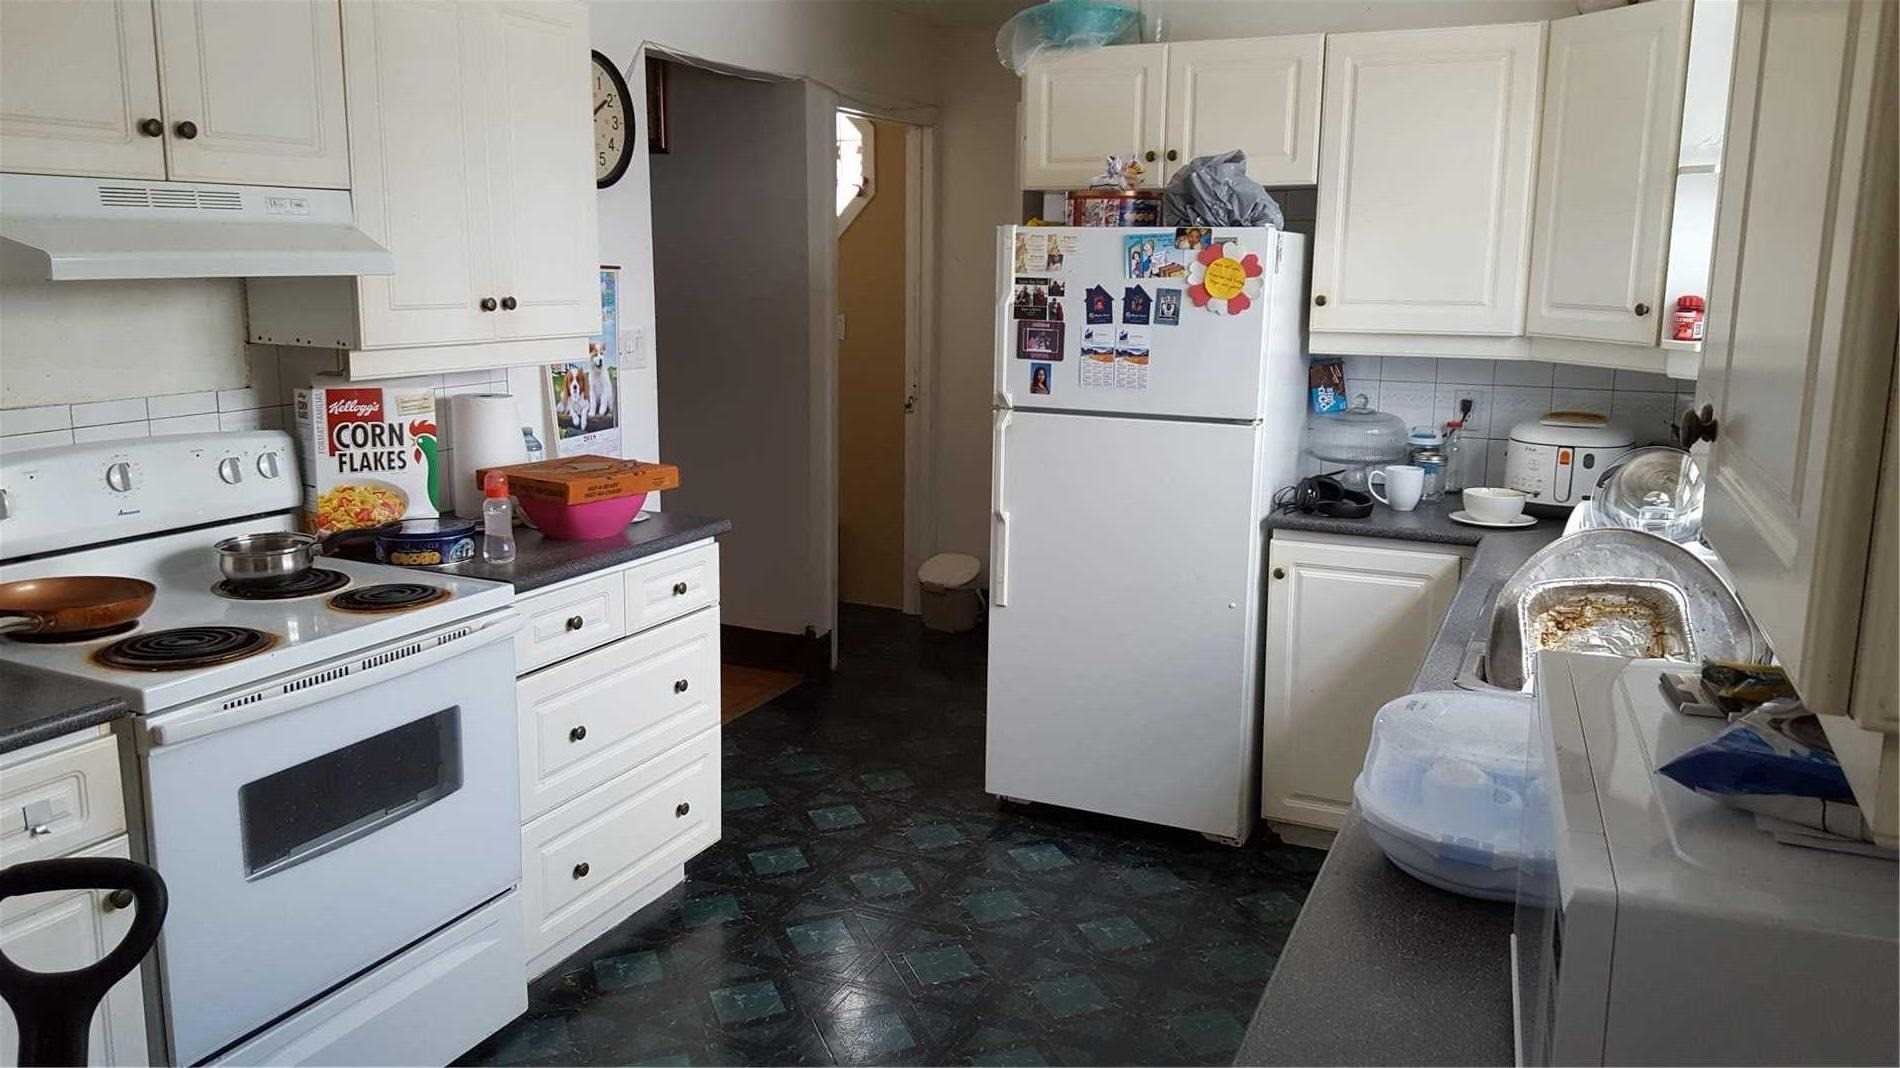
There were only two interior pictures. Here's the kitchen, complete with Kellog's Corn Flakes product placement:
How rare inexpensive houses have become
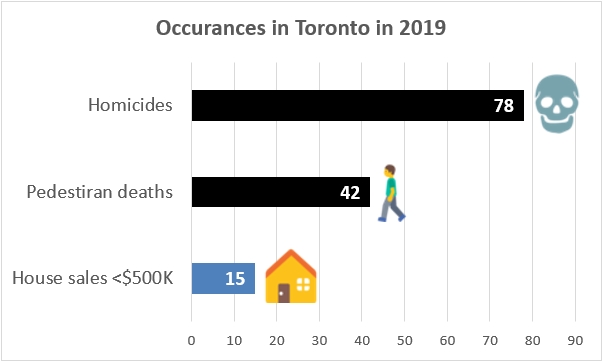
Above I mentioned how there are only 4 neighbourhoods with an average selling price of less than $750K. I decided to drop that bar a bit and I looked up how many houses (I excluded vacant lots) across the whole 630 square kilometres of the City of Toronto sold for under $500K during 2019. The answer was only 15. To look at that another way, there were over 5 times as many people murdered in Toronto last year as there were people that were able to buy a house under half a million dollars. Or nearly 3 times as many pedestrians were killed as people that bought houses for less than $500K.
Weston and the Least Expensive List: that train has left the station
When I first did these lists based on 2016, W04 Weston was the 9th cheapest place for a detached home (it was $645K back then, while neighbouring Mount Dennis was the lowest at $562K). In 2018 it was just off the list at 16th by seeing its average detached prices climb $116K in just two years to $761K. This year it grew a further $108K to $869K, which puts it down to 26th cheapest, well clear of the list. Over a period where the average Toronto detached grew 5.3% (1.3% annually), Weston prices have grown 34.7% (7.7% annually).
I think a lot of that has to do with the Union Pearson Express train. The service began in June of 2015, but it didn't really take off until fares were slashed in March of 2016. It only takes 14 minutes (and $5.65) to get to Union Station and 11 minutes (and $5.30) to Pearson International Airport.
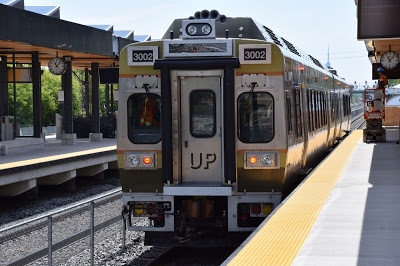
photo via: Glad Hobo Express
Rankings climbers: lots of action near the Danforth
Here are the neighbourhoods that climbed the most in rankings last year (2019 transactions in brackets).
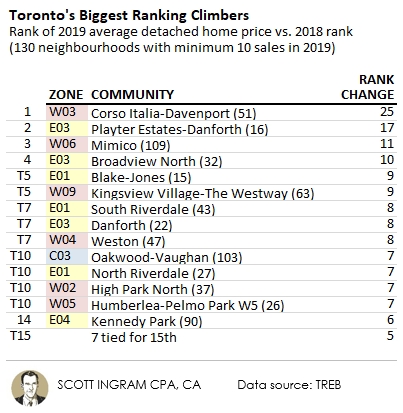
I note that 6 of the top 14 are in E01 or E03. Those are just east of the DVP, and more like the central areas they're west of Victoria Park (the Scarborough border). A lot of people like it there because prices tend to be cheaper in the east, but you can access the subway via the Danforth. I tell all my clients that want to look in these areas and be walkable to the subway that the problem with that is, so does everybody else looking in the east. That makes for a lot of competition in these areas. City-wide in 2019, 37% of all freeholds sold for over the asking price. Well in E01 that number was 73%, and in E03 that number was 58%. These two TREB zones (E01 and E03) also accounted for 7 of the lowest 15 days on market (DOM) stats in 2019 (as you'll see in the companion post to this).
These two east zones also feature 2 of the 3 hoods to make the top 15 climbers list last year and this year:
- E01 South Riverdale has climbed #61 > #47 > #39
- E03 Danforth has continued to keep pace, remaining 6 places back of South Riverdale #67 > #53 > #45
- W06 Mimico has climbed #87 > #74 > #63
Ranking declines: What's happening by the lake?
Here are the neighbourhoods that fell the most in rankings over the last year (2019 transactions in brackets).
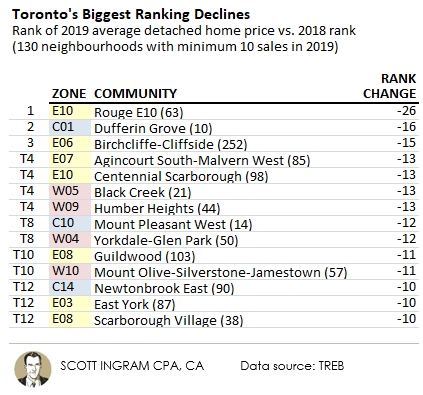
One to note here is C01 Dufferin Grove, down 16 spots. This is a great example of what I was talking about with lower sales numbers. In 2018 it was on the list of biggest ranking climbers, gaining 18 spaces. It had 20 detached sales with an average price of $1,763K. Of the 20 sales, 13 were for $1.5 million or more, and 7 were $2 million or more. Then in 2019 there were only 2 sales over $1.5 million. I sold one of those and based on the interest we had and the 8 offers, I can tell you that the area is strong and only getting stronger. But with relatively little sales, things can really swing from year to year.
The only neighbourhood to make this list back-to-back is E07 Agincourt South-Malvern West. In my last three looks it has fallen #82 > #69 > #63. This area runs north of the 401 between Kennedy and Markham Road. I'm not intimate enough with it to suggest a reason.
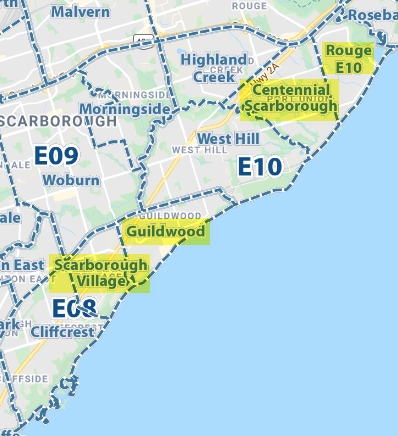
Four of the ones on the decliners list are in E08 and E10, which hugs lake Ontario from Midland Rd east to the Pickering border. The four are almost consecutive, with only West Hill in the middle escaping the top decliners list (though it fell one spot). Just out of the frame along Lake Ontario to the west is E06 Birchcliffe-Cliffside, which is number 3 on this list. I'm not sure why the lake isn't popular. You may remember above that Mimico (along the lake in the west) has been on the top gainers list the last couple of years.
So now, the moment you've been waiting for...
The Interactive Map
First a couple of notes. This map has 140 neighbourhoods, while TREB has 144. That's due to the map having one area where it combined 3 TREB hoods, and two areas they combined 2 TREB hoods. In those combination instances I added all the TREB sales and prices for the multiple hoods to get an average for the combined entity on the map. There are also a couple of name changes to note, most of them slight.
Name changes:
Old East York (map) = E03 East York (TREB)
Danforth East York (map) = E03 Danforth Village-East York (TREB)
Taylor-Massey (map) = E03 Crescent Town (TREB)
Humber Heights-Westmount (map) = W09 Humber Heights (TREB)
Leaside-Bennington (map) = C11 Leaside (TREB)
Oakwood Village (map) = C03 Oakwood-Vaughan (TREB)
Combined areas:
Pelmo Park-Humberlea (map) = Humberlea-Pelmo Park W4 + Humberlea-Pelmo Park W5 (TREB)
Waterfront Communities-The Island (map) = Waterfront Communities C1 + Waterfront Communities C8 + The Islands C1 (TREB - no detached sales in these 3 anyway)
Rouge (map) = Rouge E10 + Rouge E11 (TREB)
Coming next
Stay tuned for the second part of this series, where I show the biggest gainers and losers to see which neighbourhood's prices are rising or falling the most or the quickest.
Notes on methodology
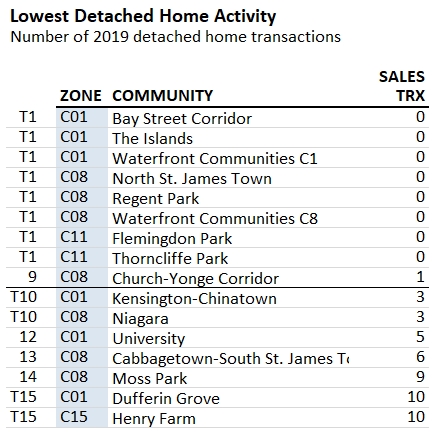
Data relates to the City of Toronto only (416). Only detached homes were used, to attempt the best possible “apples-to-apples” comparison. The “Top 15” lists exclude the 14 TREB neighbourhoods (of 144) with less than 10 detached house sales in 2019 (there were 17 excluded in 2018). Here's a list of the lowest 15 detached sales, of which the 14 under 10 were excluded from the analysis above. For the most part the housing in these areas are dominated by purpose-built rental apartments or condominiums.
About Scott Ingram CPA, CA, MBA
Would you like to make better-informed real estate decisions? I believe knowledge is power. For that reason I invest a lot of time researching and analyzing data and trends in the Toronto real estate market. My Chartered Accountant (CPA, CA) side also compels me to perform a lot more due diligence on properties my clients are interested in purchasing. If you have better information, you should have less risk and be in a position to make better decisions for your hundreds of thousands of dollars.
Your home is the single largest investment you'll make - trust it with an accountant.
Post a comment