

Back in March I wrote a blog post looking at the price gap between detached houses and condo apartments in the 416, noting it had come well off of the spring 2017 highs and was back to 2015 levels (on an absolute dollars basis) or 2013 levels (on a ratio basis). At that time I wrote:
It may be a good time for move-up buyer to swing from a condo to a house as the price gap is back to 2015 levels. Then again, there may be more gap shrinking to come. I don't have a crystal ball, but with condo inventories still extremely low (active listings at about 40% below average levels), condo prices seem very likely to be increasing in the short term. Houses are trickier to gauge at the moment.
I thought now would be a good time to re-visit this gap and see what has happened since March.

 Photo by GregPlom courtesy of Pexels
Recent price gain history
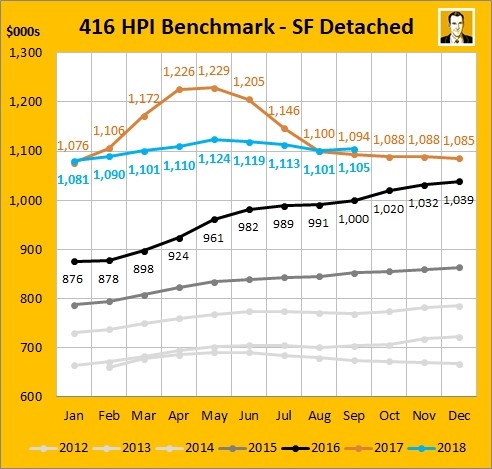
The below chart compares the December 31 average 416 price to the prior year's December 31 price (and current month versus December 31 in the case of 2018). I'll point out Houses is all types (detached/semi/row) but detached is about 70% of that. And condos include condo apartments and townhouses but apartments are about 90% of the total.
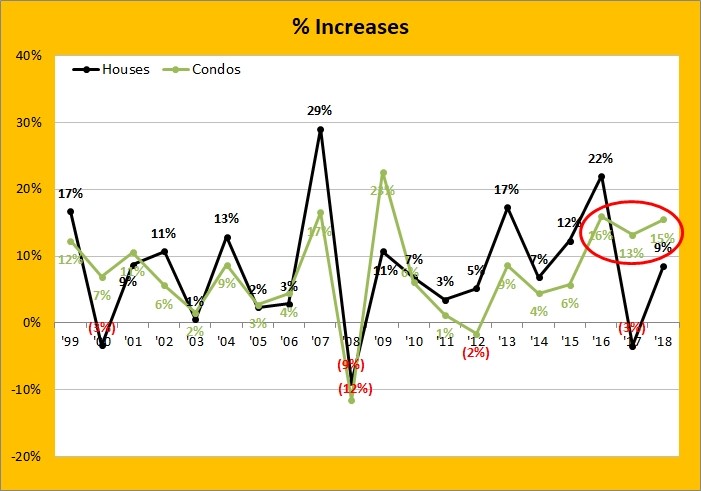
Note how houses had a larger percentage gain for 7 years in a row from 2010 to 2016. That's going to grow the gap - especially since houses are on a larger base number.
But you'll also see that condo price growth has outpaced house price growth (which was actually house price shrinkage last year - the first time since 2008). So that's going to shrink the gap.
Dollar gap rolls back to 2015
Now the gap is down to $727K, which hasn't moved much at all from the $712K it was in my March post. That's a far cry from the three months last year where the difference was over $1 million, peaking at the highlighted $1,061K in February 2017. The September numbers are labeled, so this is the smallest September since 2015.
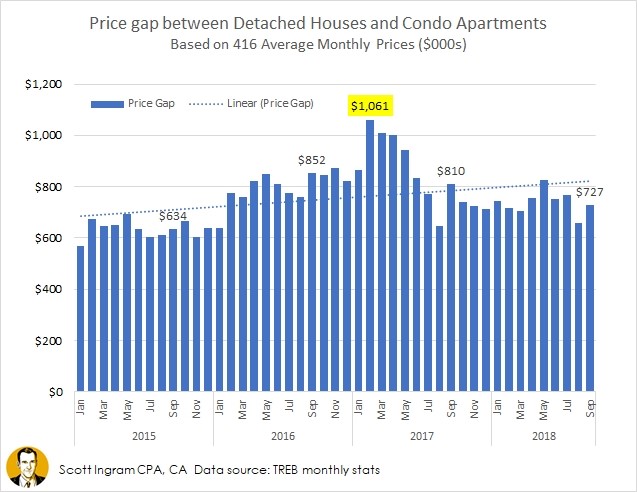
If I look at the average price gap in each of the years it has been:
2015: $635K
2016: $798K
2017: $843K
2018: $738K (YTD)
Point of all this? It may be a good time for move-up buyer to swing from a condo to a house as the price gap is back to 2015 levels. Then again, there may be more gap shrinking to come. I don't have a crystal ball, but with condo inventories still extremely low (active listings at about 40% below average levels), condo prices seem very likely to be increasing in the short term. Houses are trickier to gauge at the moment.
Price ratio rolls back to 2012
If you look at this chart back to January 1996 (start of available TREB monthly data), you can see that the ratio of house prices to condos was around 2:1 from 1996 to 2011 (in other words, detached houses were twice as expensive as condo apartments). In fact the average month during those 16 years had a ratio of exactly 2.00. The median was also 2.00. The range was pretty tight, staying between 1.72 and 2.31.
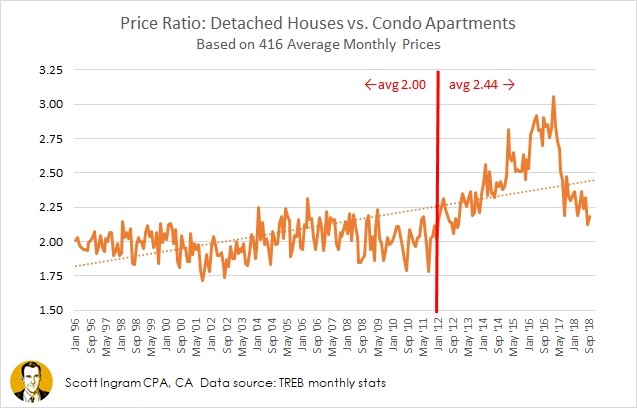
But since January 2012, the ratio has been rising, with an average of 2.44 over the last 81 months (range of 2.06 to 3.06). Let's have a closer view at the ratio in this decade, with the same demarcation line drawn in.
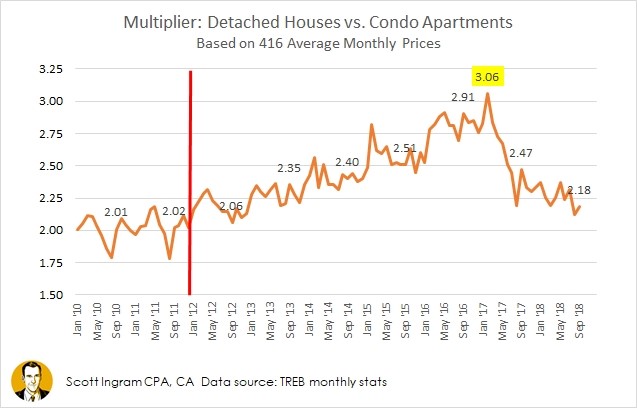
Other than the highlighted high of 3.06, the numbers shown are all for September. So the 2.18 figure for September 2018 is the lowest September since 2012 (2.06). Though note that the dollar game at that time was "only" $400K (compared to $727K today). The crazy thing is that represents an increase of $4,540 a month over those 6 years - and that's just the price gap. The average 416 detached house price has increased $7,854 a month in that time (up $566K from $777K to $1,342K).
The August 2018 number of 2.12 was the lowest single month since November 2012 (2.10) and the lowest August since 2011 (1.78 - August is usually the lowest month of the year).
So who is this good for?
Well the fact that detached house prices have been treading water for 14 months is certainly a relief (and they are back to where they were 20 months if you go back to Feb 2017).
That, coupled with the rise in condo prices in that time (same HPI benchmark for condo apartments is up $58K since Aug 2017) has allowed the ratio to shrink to September's 2.18 figure. It makes me think of the affordability indicators (which compare income to housing costs). Historically if housing costs have crept up too high compared to income (see late 1980s), they revert back down to an affordable level.

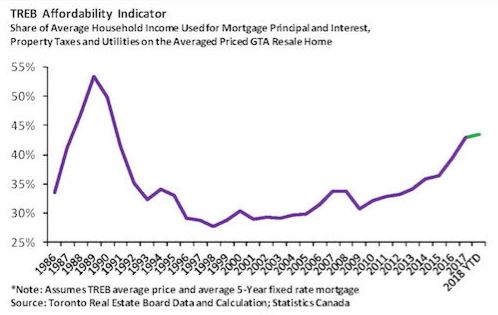
The above chart seems to pull back down if it gets to 35% or 40%. For houses versus condos I'm unsure if the long time historical mark of 2.00 acts in a similar way., or if that was just coincidental over a 16 year period. I wonder if this detached/condo apt has a point that things have a natural tendency to revert to. Two reasons I think we may be in a different world now are:
1) Mix - The composition of housing is staying the same in the 416 as the number of net-new houses being built within City of Toronto boundaries is small. But condos keep getting built. And the newer condos are a lot smaller than older condos. So the average condo sold is shrinking in size. That will drag down the average condo prices.
2) Investors - I think an important part of this ratio staying in line for so long was that condos were used as a stepping stone property, as I mentioned in my original blog post on price gap. People bought a condo to get on the property ladder, then moved up as they built some equity, increased their salaries as they progressed in their careers, and/or outgrew the space with the addition of spouses and possibly kids. But now these condos aren't necessarily turning over. There are a lot more investors in the condo space, and people are holding these properties as they buy up. Or the condo units were bought by people that had already moved into houses years ago and wanted a real estate investment on the side. So the sale of these investment properties is becoming less connected to the old "cycle of life" of property ownership.
Anyway, if you do have a condo and you are thinking of trading up, detached houses have become much more within reach this year.
About Scott Ingram CPA, CA, MBA
Would you like to make better-informed real estate decisions? I believe knowledge is power. For that reason I invest a lot of time researching and analyzing data and trends in the Toronto real estate market. My Chartered Accountant (CPA, CA) side also compels me to perform a lot more due diligence on properties my clients are interested in purchasing. If you have better information, you should have less risk and be in a position to make better decisions for your hundreds of thousands of dollars.
Your home is the single largest investment you'll make - trust it with an accountant.
Post a comment