

Here's your Toronto real estate market report for April. Overall GTA-wide sales numbers were up a whopping 16.8% over 2018, but as always, we like to dig a little deeper.

Below is what I saw in the April stats. As always, these are just selected highlights. The full set of market charts is available on SlideShare.
1) Don't get too excited just yet over sales
Okay, it is encouraging that both 416 condos and freeholds (i.e. non-condo ownership) broke streaks of 5 months in a row of negative YoY sales. For condos, it was actually lower than the prior year for 21 of the previous 23 months. One month's result doesn't fix a slump (it's still 21 of 24 months that were lower than the prior year), but it could be a sign. (Total aside but I always take issue when sports announcers say "He broke out of a 1 for 20 slumps with that single to left field." He's now 2 for 21 and might go his next 10 at bats without a hit. One result doesn't reverse the narrative.
For the whole TREB reporting area (let's call that "GTA"), sales transactions had been floating right around 2018 levels in the first three months of the year until the big 16.8% YoY increase in April:
Jan +22
Feb -123
Mar -1
Apr +1298
But let's back up and look at that with a broader perspective:
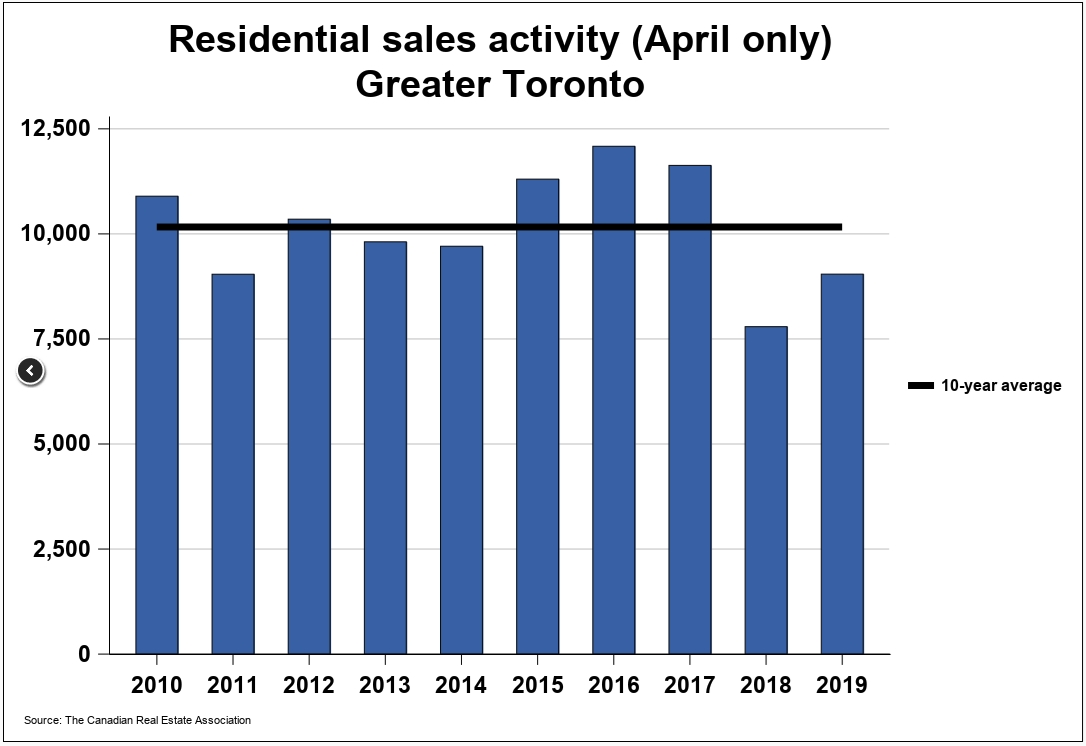
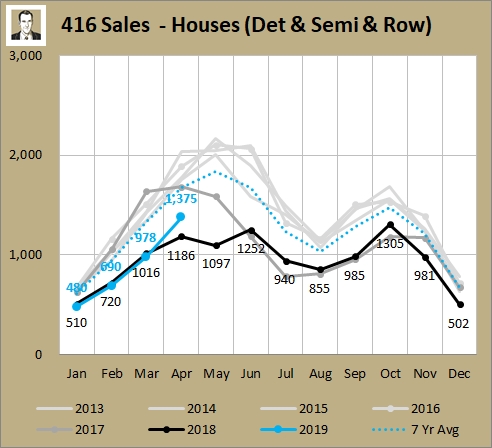
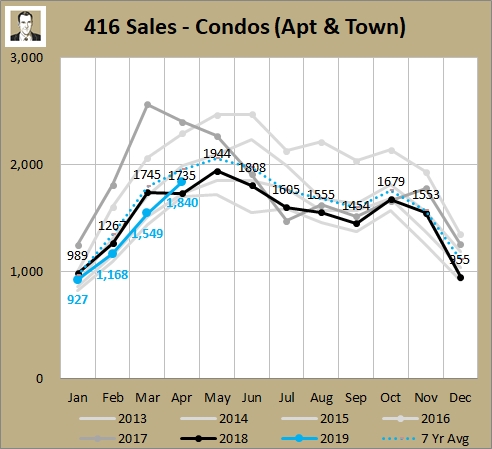
It's only a big jump over last year because last year was so bad. That said, it's better than January to March where it was roughly even with the bad year. Zooming in on our 416 focus, both freeholds and condos had their first month that was better than 2018.
So April transactions were better than 2018 but still below recent averages.
2) Condo price growth deceleration stops slide?
Last month I talked about weakening in the condo market (which I've been mentioning since December results). Annual price gains had been decelerating for 3 months in a row. That streak has stopped (though the same comment as above about one month's results don't mean a slump has been broken).
YoY price gains on condos:
Dec 11.5%
Jan 8.6%
Feb 7.3%
Mar 2.2%
Apr 5.8%
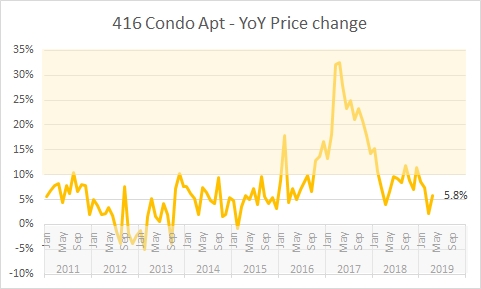
To repeat the point of last month, price growth spends a lot more time in the clear 0 to 10% YoY growth range than it does in the yellow >10% range or the grey <0% range. That 30%+ YoY price growth peak was not sustainable and at some point regression to norms was coming.
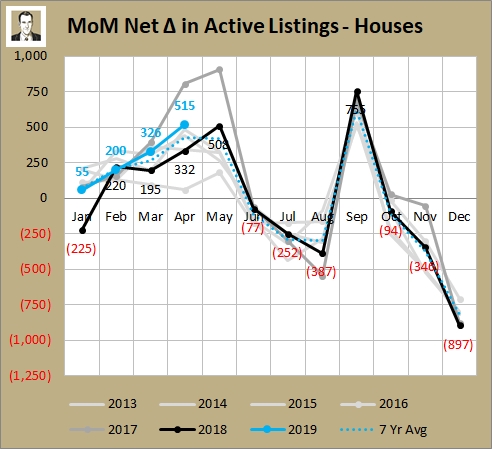
3) Freehold active listings jumped a lot
Sometimes it's not just the absolute level of active listings that are important to watch, but how quickly things are changing. Here are absolute number of 416 freehold active listings (which are always a snapshot on the last day of the month). In April they look to be on the high side of recent ranges.
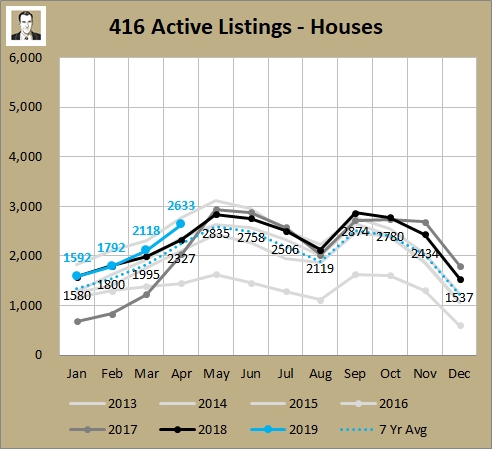
It's perfectly normal for them to rise from March to April. Does it every year. However, note the rate of the month over month increase. That 515 is above the 7 year average, and only lower than 2017 when people started tripping over themselves to cash in on the mini bubble peak before it was too late. The increase in sales this April has helped absorb this increase in inventory, but it's something I'm watching, as March was above average also.
As always, you will find the full set of market charts (for this month and prior) on my SlideShare.
► To share this post or to add your comments, scroll down a bit below.
About Scott Ingram CPA, CA, MBA
Would you like to make better-informed real estate decisions? I believe knowledge is power. For that reason I invest a lot of time researching and analyzing data and trends in the Toronto real estate market. My Chartered Accountant (CPA, CA) side also compels me to perform a lot more due diligence on properties my clients are interested in purchasing. If you have better information, you should have less risk and be in a position to make better decisions for your hundreds of thousands of dollars.
Your home is the single largest investment you'll make - trust it with an accountant.
Post a comment