

Just how closely does early 2020 resemble early 2017 in Toronto real estate?
Thursday Feb 27th, 2020
There has been a lot of media and social media talk in the past couple of months comparing the beginning of 2020 in the Toronto real estate market to how things were feeling as the market heated up in a ridiculous way in the beginning of 2017.
Check some recent headlines:
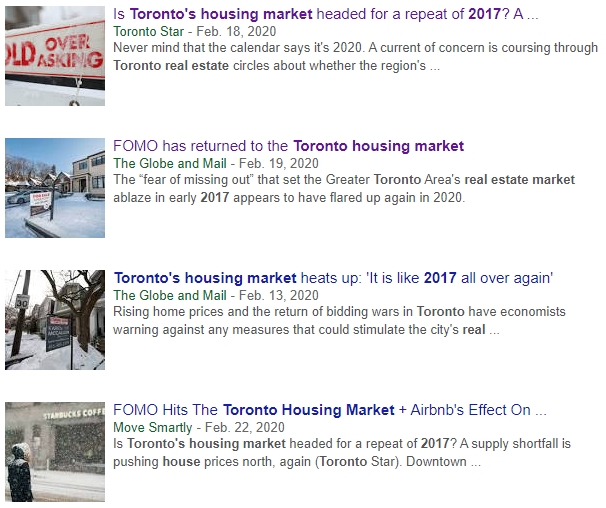
Heck, I’m guilty myself, titling my most recent monthly report "January 2020 charts: smelling a bit like 2017."
The main driver: low inventory
As my chart from the January stats shows, 416 freehold inventory is unusually low. Active listings are 13% lower than last year and 33% lower than the average of the last 7 years.
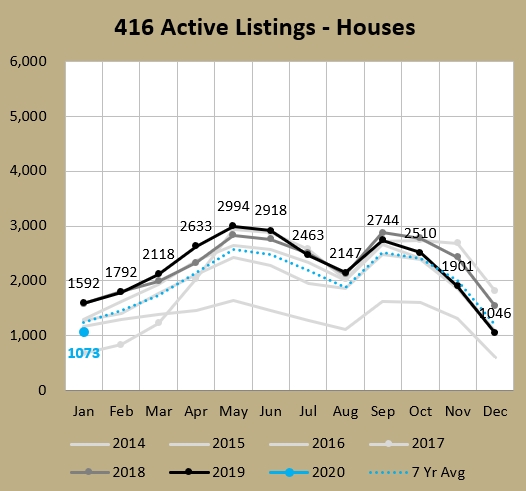
Looking at that 1073 mark for January, it's actually the second lowest in the last 25 years (TRREB only has monthly data available to January 1996). The only time January active listings were lower was in - you guessed it - 2017. But that was in a league of its own, with a ridiculous 679 listings, nearly 400 lower than this year.
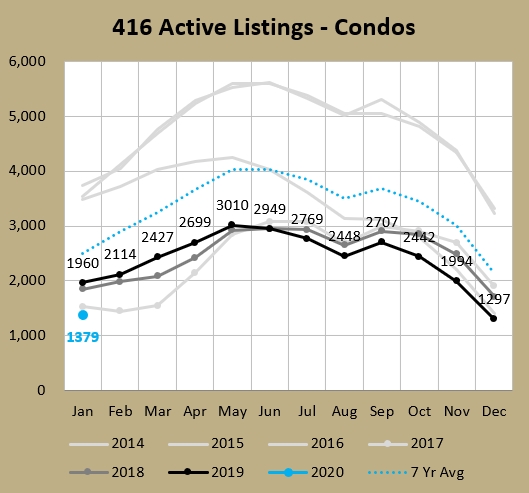
The situation for condos is even more grim, if you can believe it. They are 33% lower than at the end of January 2019 and 45% lower than the 7-year average. And it was the smallest amount of January active listings in the last 25 years. That’s even more remarkable when you consider how many tens of thousands of condo units have been constructed over that time and how much the city’s population has increased.
Freehold Mania – as bad as 2017?
The percentage of listings that sell for over the asking price (Sold Over Asking, “SOA”) is a statistic that I track manually because the Toronto Regional Real Estate Board ("TRREB") doesn’t publish it. My theory is that when things are getting wild as far demand relative to supply for a type of housing or a neighbourhood, agents will far more frequently employ the “under-list the price and hold offers to spark a bidding war” strategy. So the hotter things are (in an area or month or whatever), the higher the SOA % will be. In contrast, you wouldn’t use that listing strategy in Phoenix, Arizona in early 2008 when months of inventory (“MOI”) was around 17. (For context, 4-6 MOI is considered a balanced market, with lower being a seller’s market, and higher being a buyer’s market. Toronto has pretty much been in a seller's market for over 20 years. MOI for 416 freeholds in January was 2.0.)
You can see here how at peak madness in 2017, 4 of every 5 freehold sales were for over the "asking" (or list) price.
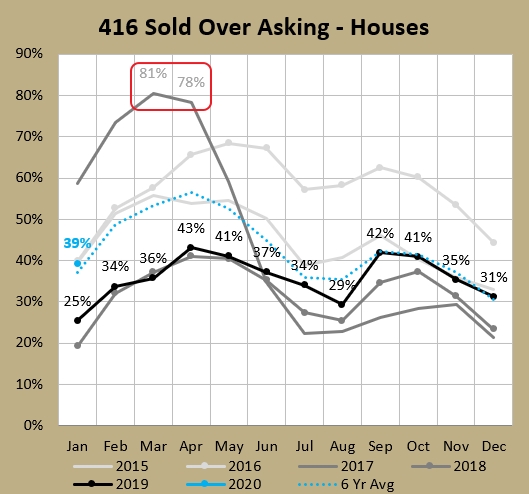
January 2020 rang in at 39%, which was right on par with 2015 (39%) and 2016 (40%). Still, it was a good chunk below 2017's January record of 59%. Looking at that statistic on a monthly basis is usually sufficient to get a handle on the market. But we are nearly at the end of February, and when the market is getting nutty (in either direction), I’ve looked in on a weekly basis at some stats.
Now is one of those nutty times.
So let's take a look-in at the weekly change in SOA to see how it was tracking versus recent years.
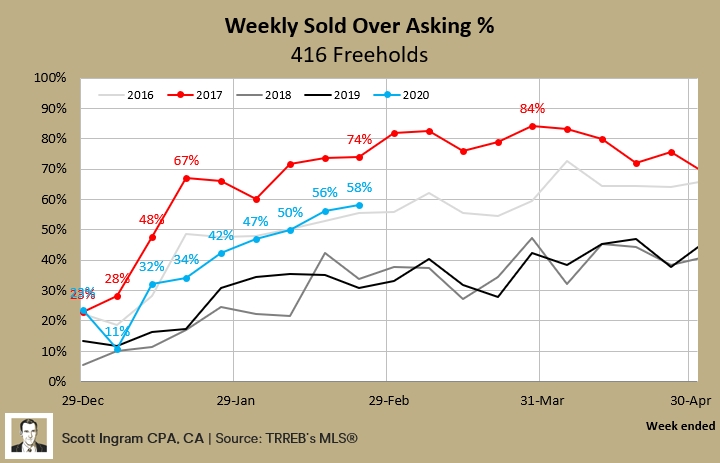
So it's climbing neck and neck with 2016 (which I'll remind you was a record year for GTA sales volumes), but still a bit back of bananas 2017 (where there were 5 weeks above 80%). The 58% for last week (I'm tracking Monday to Sunday) was the highest mark since May of 2017, which is just cut-off on this chart but it was when this stat was rapidly declining on a weekly basis.
While the above chart shows things are not quite as heated as 2017, I think the next chart shows that even more clearly. Instead of just "over asking" (I use 1% or more above list price), this one tracks the share of sales that were for 20% or more above the list price.
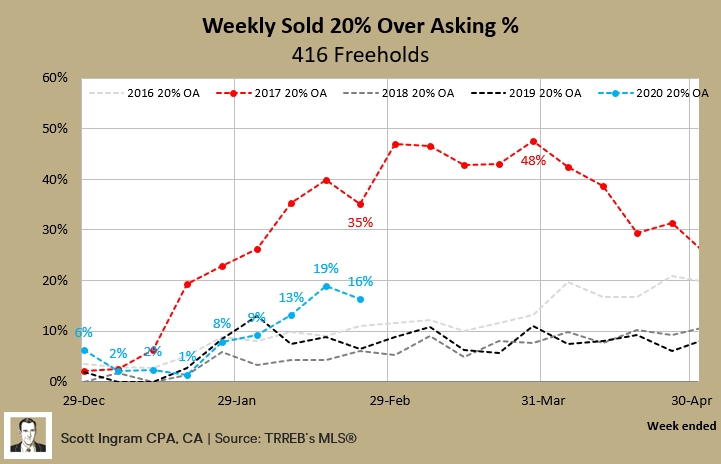
Things got so out of hand in March of 2017 that in some weeks, nearly half of all sales were for 20% or more above the asking price. Prices were escalating so quickly that agents were unsure how to price things so they just threw up any old price and let the multiple bidders fight it out. And buyers were so consumed with FOMO that they were setting new area pricing records on a listing by listing basis.
You can see above with the 16% in the most recent week, that things are high for February but it's not close to being 1 in 3 listings like it was at this time in 2017. It has been my experience in these first couple of months of 2020 that buyers are nervous, but not as hell-bent for getting in at any cost as they were in 2017.
But Condo Mania - that might be a thing
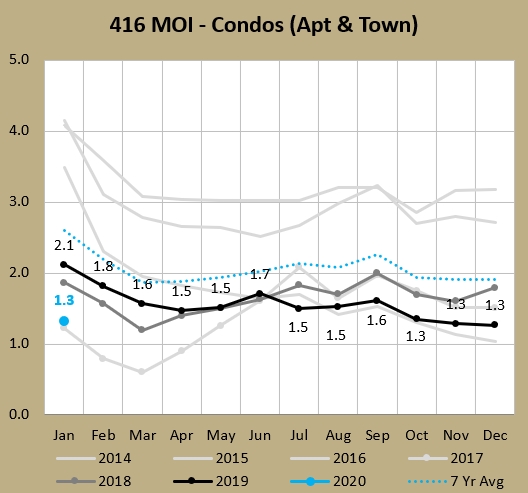
We talked about months of inventory above, which is the relationship between sales and inventory (sales for the last month divided by active listings at the end of that month). The lower the number, the deeper into seller's market territory it is. Condo MOI has been below 2.00 in 45 of the last 47 months. That's low. The lower it gets, the more upward pressure it puts on prices. The 1.3 in January was just behind the 1.2 posted in January 2017. That was a continuation of the last half of 2019 (black line) looking a lot like the last half of 2016 (light grey with no dots just below the black line).
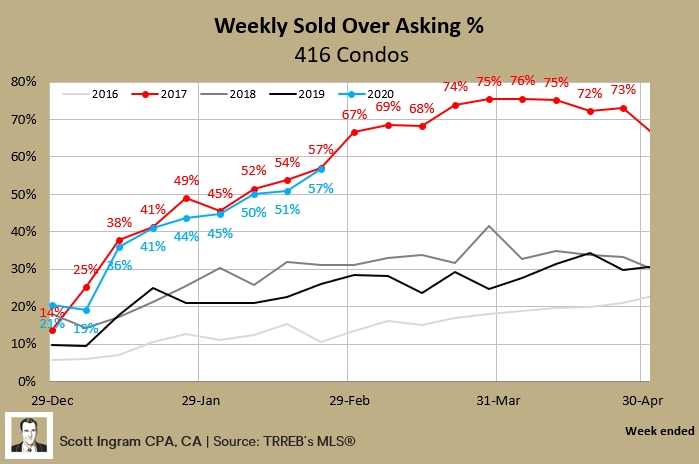
So that's looking very similar. Let's switch over to our weekly view of SOA. As you see below, 2020 is definitely hotter than other recent years, and eerily similar to 2017.
Pretty much all of the condos my clients have been interested in so far in 2020 have had multiple offers happening. I remember one bully offer that ended up getting 6 offers scrambled together on short notice. And I fired in an offer on another unit ("offers anytime") which I thought would beat the crowd only to find out somebody else had managed to whip one up too.
Looking at the chart below, on one hand we haven't seen weekly numbers as high as 6% since June of 2017 (on the way down from that 25% peak in April). But on the other hand, I'm reading that things aren't quite as insane as early 2017. (Though another couple of weeks of data would be more conclusive.)
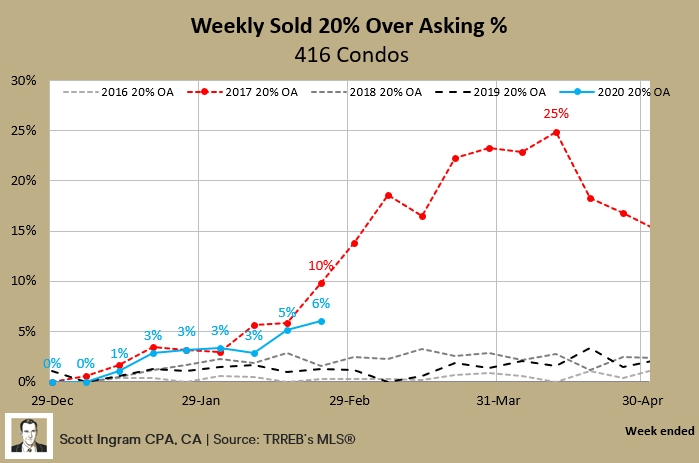
Keep in mind that the average 416 condo price in December 2016 was up 16% year-over-year, then price gains rapidly accelerated to reach a peak of 31% in March, and 30% in April of 2017. In contrast, December 2019 had average 416 condo prices up 9% year-over-year. Part of the reason for the number of 20% over asking sales in 2017 was mentioned earlier, i.e. prices were going up so quickly that agents just weren't sure what to price at. Things are definitely heated right now, but price gains haven't been as stratospheric and we haven't quite reached that level of irrationality yet.
Conclusions
Freeholds: have the low inventory (though not as insanely low), but don't have the price appreciation, nor quite the level of sold over asking madness - especially in the sold 20% over asking.
Condos: have the record inventory and low MOI, and sold over asking is tracking to 2017 levels. However the price appreciation isn't as wild and the 20% over activity isn't nearly as bad as peak 2017.
As you'd suspect, I'll continue to monitor the situation.
About Scott Ingram CPA, CA, MBA
Would you like to make better-informed real estate decisions? I believe knowledge is power. For that reason I invest a lot of time researching and analyzing data and trends in the Toronto real estate market. My Chartered Accountant (CPA, CA) side also compels me to perform a lot more due diligence on properties my clients are interested in purchasing. If you have better information, you should have less risk and be in a position to make better decisions for your hundreds of thousands of dollars.
Your home is the single largest investment you'll make - trust it with an accountant.
Post a comment