

Here's your Toronto real estate market report for the month of January. Whereas last year got off to a slow start (really through all of Q1), the uptick in the last three-quarters (and especially half) of 2019 has carried into this year.

Below are my top observations of the month's statistics. The full set of market charts is always available right here on my website (NEW!), or on my SlideShare.
1) Condos are H E A T E D
Here's an anecdote. Condo goes up on the market last Monday. Was holding offers for the following Monday. TREB hood was C08 Moss Park. Booked to see it with my buyer client Wednesday 6 pm, but was called by the listing agent to say a bully offer that expires 7:30 pm but they're not sure what they want to do with it. Saw it anyway. Texted agent afterwards just to give heads-up that we wouldn't be firing in an offer for 7:30 pm. She said they were just going to let it expire, but now they got another one and offers will now be the next day (Thursday) at 5:00 pm. I registered my offer a couple of minutes before the cut-off at 4:00 pm (usually I don't wait until last minute by the lawyer didn't get a chance to review the status until late). At that just-under-the-wire time I was told there was only one other offer. Then my client ended up not bidding because there was a lawsuit in the status that she was uncomfortable with. So I called in at 4:30 pm to un-register and was told that it was just the one other offer still. Again, offer presentation was at 5:00 and we were all instructed to register 4:00. Basically all "registering" is, is calling the listing brokerage's front desk to say you're bringing an offer so that all other realtors can be notified as to the most up-to-date count.
So I talked to the agent later in the night and they ended up with 6 offers. And the place sold firm in 3 days on market (DOM) and for $110K over asking (which, whatever because we know the price was artificially low).
That's been about how it's been going this year, from my own experience and from hearing from other agents. Pretty much all the charts this month back up this anecdotal evidence, but here's a really good one:
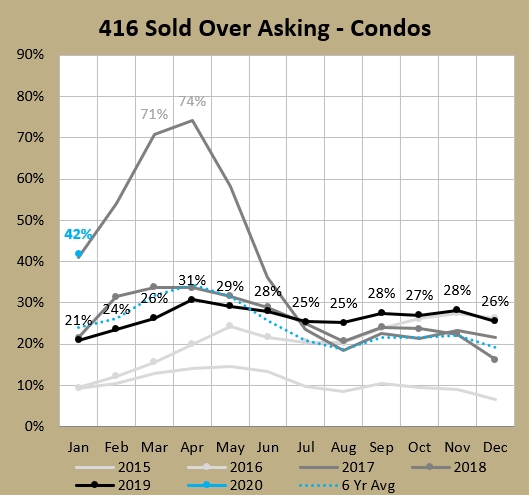
Yes, 42% of 416 condos sold for over asking last month, which is higher than January 2017 as we entered the peak of the market. The 16% month over month (MoM) jump from December's 26% to January's 42% was the second largest jump ever, second only to the 17% jump from 54% in February 2017 to 71% in March 2017.
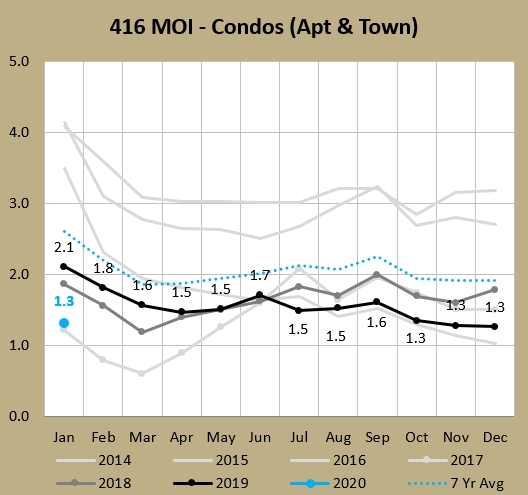
Want another one? Okay, then let's look at months of inventory (MOI). The lower this is, the deeper into a seller's market we are (below 4 is considered seller's market territory). As with sold-over-asking we are very close to the January 2017 number (1.3 currently vs. 1.2). To give you some reference, this is the second lowest ever (or at least the last 25 years, which is what I have monthly data for, but it's safe to assume ever as far as condos go), and the average January MOI in the last 10 years is 3.0.
More? Sure. Let's look at prices. A lower MOI usually points towards upwards pricing pressure. And yep, sure enough: new all-time monthly high for 416 average condo prices of $681K.
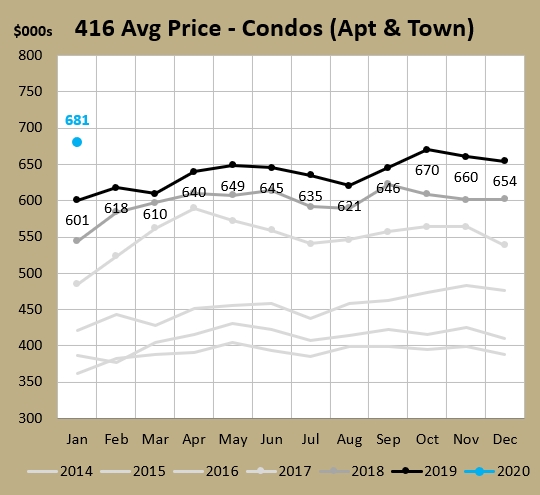
By the way, that spring 2017 peak that people like to talk about? That's more of an issue with detached homes. The average 416 condo price reached a new high of $590K in April 2017. It did fall to about $50K below that high at one point, but in 11 months (March 2018) it got back above $590K and has been above it ever since.
2) Why is there so much price pressure on condos?
Well it all boils down to our economic friends: supply and demand. How about we check demand first:
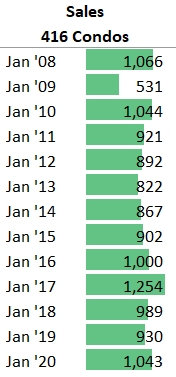
It's the 4th largest January sales figure ever, and 8% higher than the average of the last 10 years. So demand looks fairly strong. How about supply?
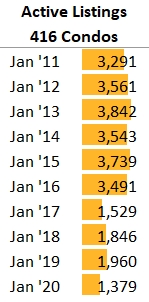
And this is the major issue, as I've been mentioning for months. The inventory is so scarce right now. There's 30% less places on the market than January last year, but even that was a low year so we are actually 51% below the 10-year average (2,818). In my November charts blog post I hypothesize around why there are so few units on the market these days, and my December charts blog post I had a section called "Low supply the big story heading into 2020."
You've got more people buying right now (demand) but over 1,400 less places available for them (supply). So that's going to push hard on prices. How is that playing out? Well you see that condos have reached a peak on the 5-year CAGR (roughly stated, the average annual price increase it would've taken to get from the average price 5 years ago until now). That's an even higher growth rate than it was at the $590K April 2017 price peak, when the 5-year CAGR was 10.42%.
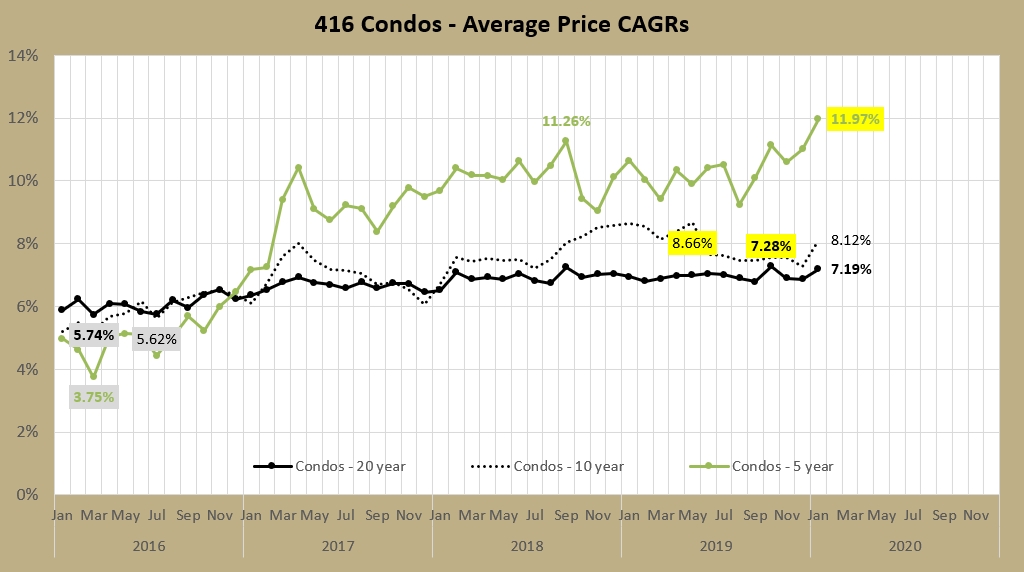
To me I look at the 5-year rate and see that it's sitting nearly 5% above the long-term (20-year) rate and figure it must regress to the mean. But it's been above 9% for 28 straight months and above 10% for 18 of the last 24 months. I'm not sure how long it can defy gravity. A regression towards the 7% long-term rate would either come in the form of pricing declines or a long period of no or slow price growth. If I took the average condo price from 5 years ago (January 2017 was $387,100) and grew it by the 7.19% long-term rate, we'd be at $547,800 now. Instead, the current average price is $681,300, or $134K higher. It wasn't so long ago that the long-term condo rate was more like 6%, either. Wild times.
3) Lowrise heating up as well
Last month I mentioned that for active listings, it "was the second lowest December ever, behind only the ridiculously low 2016 (599) heading into the stupid market heights of early 2017. Compared to the last 10 years, December had 21% fewer active listings, or a bit under 300 less houses on the market."

Well, those same conditions are carrying over into January. This is the 2nd lowest freehold active listings number for a January in the last 25 years, behind only crazy 2017. There are 30% less listings than this time last year, and 21% less than the 10-year average. Guess how that's shaking out on prices.
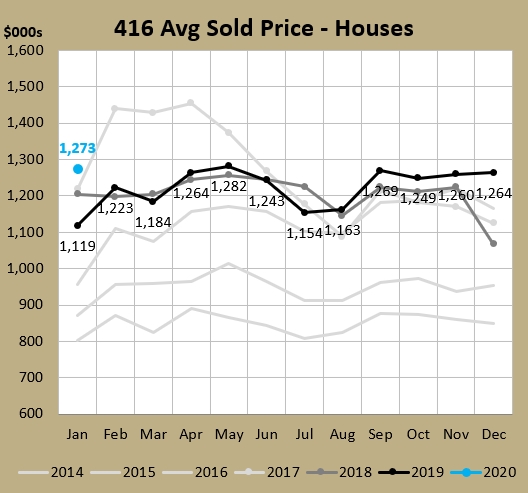
That's right - a new January price record. You want an anecdote for houses? Here are two.
First there was a fourplex in C01 Dufferin Grove listed a few weeks ago. I was talking about it with a friend of mine that lived on the street for several years before he got renovicted. This place was underlisted and holding offers. He went to the open house and he said there were line-ups to get in. The place sold for more than $200K over asking (and more importantly what a couple of online estimators predicted, though I find those algorithms are most often low anyway). But line-ups. In the snow!
Second place some clients of mine went by the open house. Place was in E03 Danforth was very livable as-is and they imagined they could work with the place and make improvements over time. It was definitely wasn't a magazine-worthy place that I thought would get a ton of offers, and I didn't think it was grossly underpriced either. It ended up getting 17offers (seventeen!) and went for $500K over asking, which is what larger homes that were nicely renovated were going for.
I'm hoping some sanity returns as we get into the spring market, as you'd hope people's memories can remember the spring of 2017, which was just three short years ago. But there seems to be some FOMO going on now and I can envision things getting worse before they get better.
As always, you will find the full set of market charts (for this month, and for archived prior months) on this page on my website (NEW!) or on my SlideShare.
About Scott Ingram CPA, CA, MBA
Would you like to make better-informed real estate decisions? I believe knowledge is power. For that reason I invest a lot of time researching and analyzing data and trends in the Toronto real estate market. My Chartered Accountant (CPA, CA) side also compels me to perform a lot more due diligence on properties my clients are interested in purchasing. If you have better information, you should have less risk and be in a position to make better decisions for your hundreds of thousands of dollars.
Your home is the single largest investment you'll make - trust it with an accountant.
Post a comment