

Here's your Toronto real estate market report for the month of December - and for the end of the year 2019 A.D. After a slow Q1 (continuing where 2018 left off), the last three quarters have had double-digit gains in sales volumes, and year-over-year (YoY) price increases have been accelerating. The return of sales volume was from the lowest GTA level (78,017) since 2008, so it's a little easier to look good comparatively.
Below are my top observations of the month's statistics. The full set of market charts is always available on my SlideShare.
1) GTA has rebounded - except York Region
Before I dig into my 416 numbers, let's look at a couple of GTA-wide numbers (i.e. total TREB). The below chart shows volumes are up 12.6% to 87,825. You can see that the large YoY increase is because 2018 was the lowest year since 2008 for sales volumes.
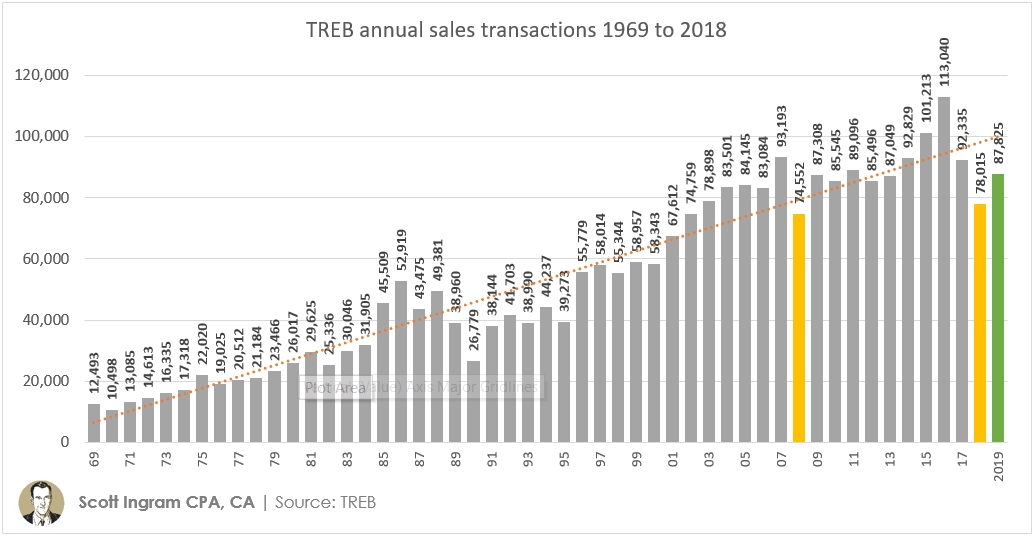
TREB pointed out in its press release that "2019 sales were in line with the median annual sales result for the past decade." The 10 year median was 88,461 so that's not far off (0.7% lower). That's a more positive spin than it was 3.7% below the decade average of 91,244. But really that was driven by a crazy 2016 spike so I do in fact see it as a return to normal. Though you can see it's below the long term trend line.
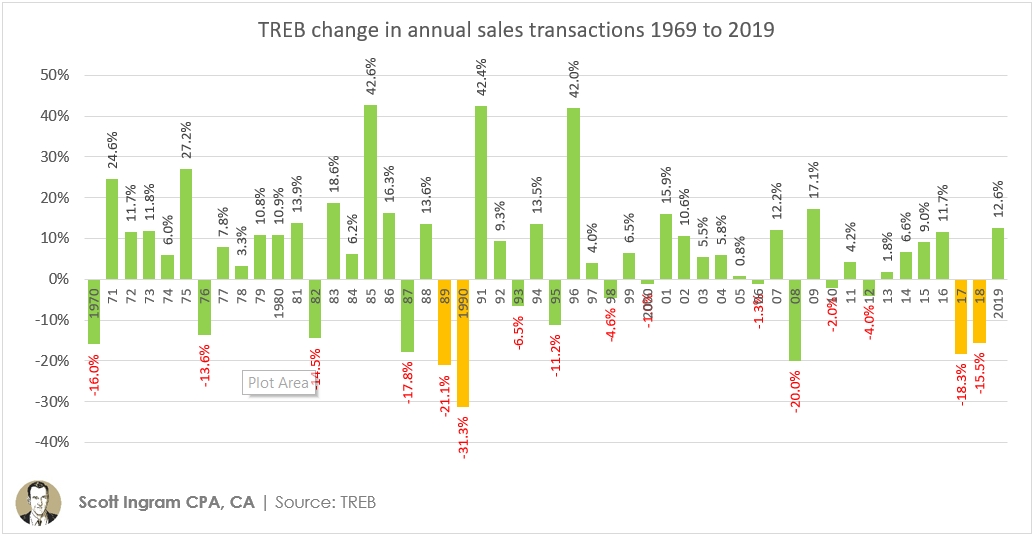
If we look at the last 50 years of YoY changes in sales (below), a rebound was likely. Of the 50 years, volumes increased in 34 years and fell in 16. Of the 16 negative years, 14 were followed by positive years (11 of those being up 12% or more such as the 12.6% increase this year). Only twice were there decreases in sales two years in a row ('89 - '90 and '17 - '18) and never three years in a row.
Switching to dollar volumes, we can see that overall TREB volumes rebounded by $11 billion, to increase 16% over 2018 levels.
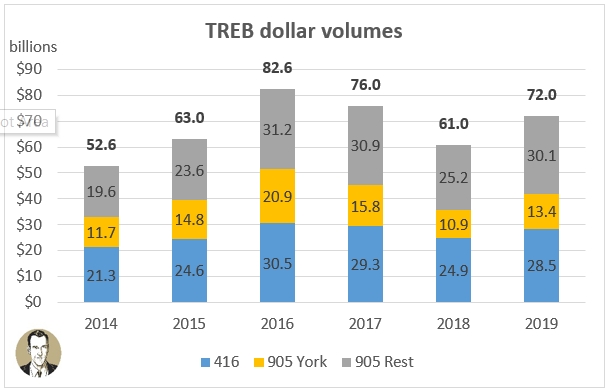
Having a look under the hood, though, we can see areas are rebounding at different paces. If I compare to the record-breaking 2016, York Region is at 64% of that dollar volume, and is actually lower than the 2015 dollar volume. Meanwhile 416 is at 93.5% of 2016 dollars and $3.9 billion clear of 2015, and the rest of 905 is at 96.5% of 2016 levels and $6.5 billion higher than 2015.
2) Low supply the big story heading into 2020
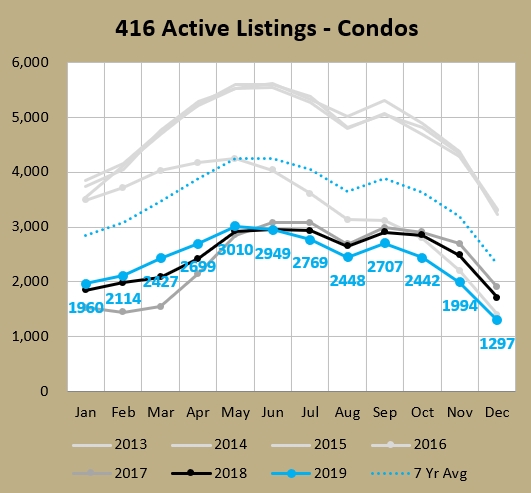
Back to just talking about the 416 now. Last month I reported that the 1,994 active condo listings at November 30 were the lowest since 2001 (back when the condo stock was at least 179K lower - just over 100K compared to 279K in 2017 per the CMHC). Well to find a lower December figure than the 1,297 just posted, you now have to go back twenty years all the way to 1999. This is 51% lower than the average December over the last 10 years. Think about it - with population growth and out of reach lowrise prices you've got more people looking at condos than ever, and at the end of December there were over 1,300 less units for them to look at.
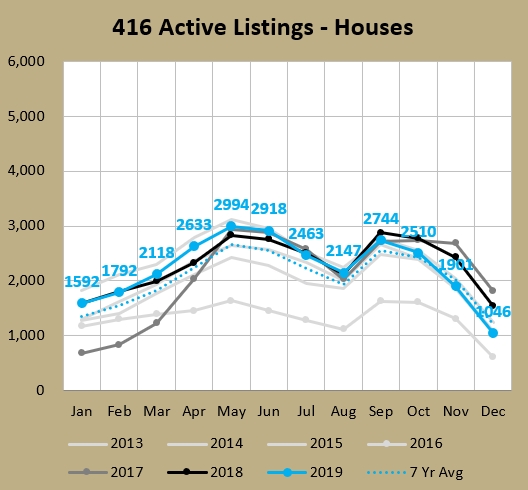
With freeholds it's not pretty either. TREB's monthly data goes back to 1996. In those 24 years, this was the second lowest December ever, behind only the ridiculously low 2016 (599) heading into the stupid market heights of early 2017. Compared to the last 10 years, December had 21% fewer active listings, or a bit under 300 less houses on the market.
Why is this a concern?
3) Tightened market points to pending price increases
Increasing sales and decreasing active listings make for decreasing months of inventory (MOI). An MOI between 4 and 6 is considered by many to be a "balanced market," while higher than 6 MOI is favourable to buyers and lower than 4 favours sellers. Toronto has been in a seller's market for a long time. The lower the MOI, the more intense of a seller's market it is, and this is when you generally see sharp price increases.
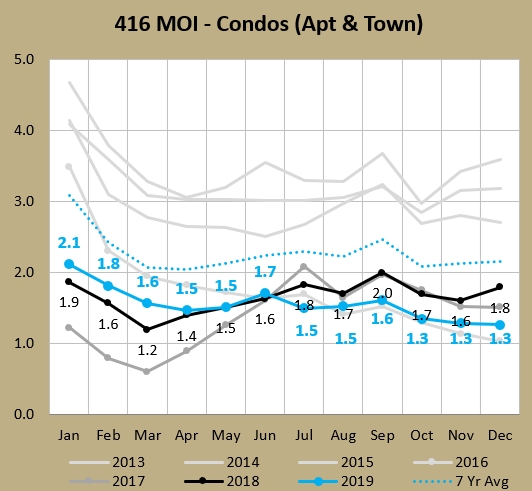
The December MOI for 416 condos is the second lowest December ever (or at least the 24 years in which I have data), trailing only 2016. Interestingly this year started out with higher MOIs than 2018, which looked like a bit of an easing in the condo market. The 1.27 has only been lower once in the last 31 months (1.19 in March 2018).
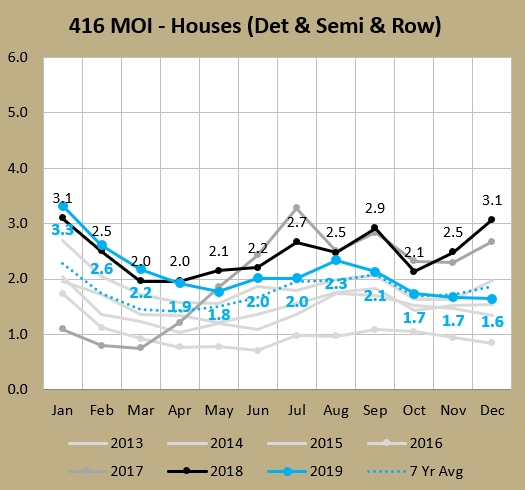
For 416 freeholds, the 1.6 MOI for December is the 5th lowest in the last 24 years. You'll note a similar pattern to condos in that the first 3 months started out higher than 2018, before dropping below (though 6 months for condos). The first 8 months were higher than the average of the last 7 years, then spent a couple of months at the average, before dipping below the average in the last two months.
4) Trading up from a condo - current price gaps
For those thinking of moving from a box in the sky into a lowrise house with a white picket fence, how is that looking? Well, if you live in an average-priced 416 condo are hoping to buy an average-priced 416 detached, the price gap is currently $707K. The good news is that hasn't really moved much in two years (December 2017 was $712K).
The current ratio of detached price to condo apartment price is 2.08 (below). I've tracked this over the last 24 years and it's usually around 2:1. From 2000 to 2009 the average was exactly 2.00. From 2010 to 2019 the average rose to 2.31, driven by a spike in 2014 to 2014 where 43 of the 48 months were over 2.25 (reaching a high of 3.06 in February 2017).
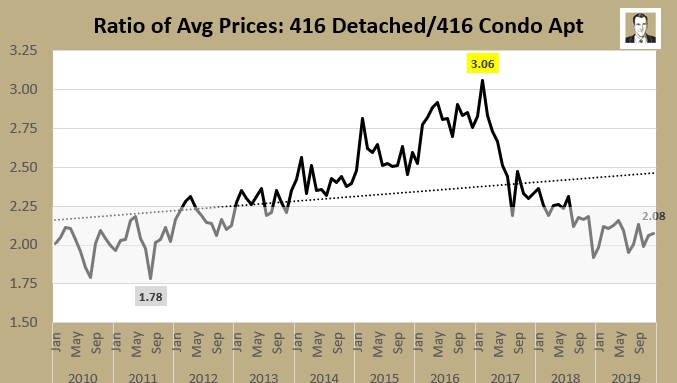
So the ratio is back within normal ranges now. We discussed above that the detached vs. condo gap is $707K. As you see below that's around what it's been at since mid-2017. In fact in the last 2.5 years it's averaged $701K. Thankfully we're down $354K from peak 2017 prices. Still if one was to trade-up, that $707K gap using a 5-year fixed rate of 2.87% and a 25 year amortization would translate to close to $3,300 a month in mortgage payments. That's an increase of nearly $40,000 a year in payments just on the price increase. I hope you got a raise since you bought that condo!
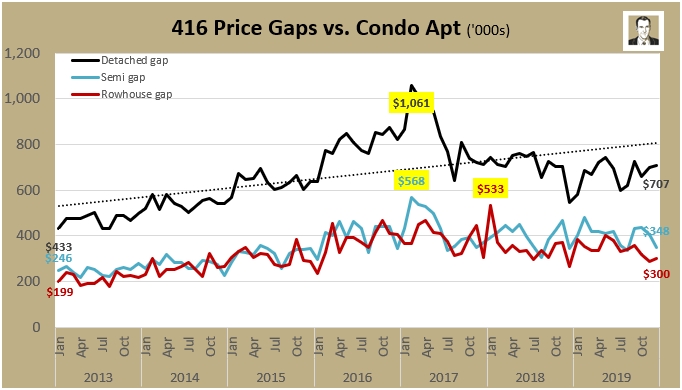
Switching to the semi-detached vs. condo gap, we can see it's sitting at $348K. The good news here is that this is pretty much the same as the $345K at December 2018 and the $343K in December 2016. Your condo has been keeping up. The only year that was a bit funky was 2017 in all of its peak-ness. The absolute peak was $568K and (now down by $220K) and the December 2017 number was $370K.
For rowhouses, the gap isn't far off that of semis, coming in at $300K. The average in the last 2.5 years has been $338K so we're sitting a bit below that.
As always, you will find the full set of market charts (for this month, and for archived prior months) on my SlideShare.
About Scott Ingram CPA, CA, MBA
Would you like to make better-informed real estate decisions? I believe knowledge is power. For that reason I invest a lot of time researching and analyzing data and trends in the Toronto real estate market. My Chartered Accountant (CPA, CA) side also compels me to perform a lot more due diligence on properties my clients are interested in purchasing. If you have better information, you should have less risk and be in a position to make better decisions for your hundreds of thousands of dollars.
Your home is the single largest investment you'll make - trust it with an accountant.
Post a comment