

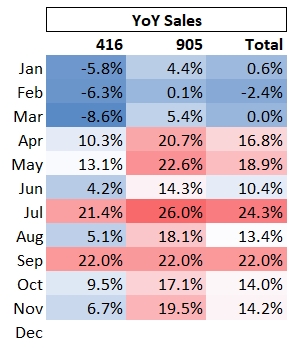
Here's your Toronto real estate market report for November. After a slow start to the year (continuing where 2018 left off), the last 8 months have all been up double-digits in sales volumes, with November coming in at +14.2% across the GTA. The climb back in sales from a very low 2018 (78,017 sales was lowest since 2008) has been going on for months. But the year-over-year (YoY) increase in prices are a huge story, as is whatever the heck is going on with condos.

Below are my top observations of the month's statistics. The full set of market charts is always available on my SlideShare.
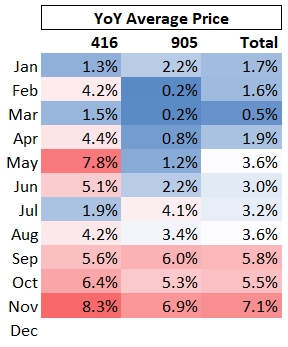
1) Price gains are accelerating across the GTA
The November average prices are up 7.1% YoY at a GTA level. That's practically double the 3.6% it was sitting at just 3 months ago. As you can see below, the 416 and a 905 both posted their best months of the year. The 905 in particular has come up a lot from the 0% to 2% annual price increases it was posting in the first 6 months.
You could point to the 905 increase being due to large gains in sales versus last year. In the last 8 months they've ranged from 14% to 26% higher YoY. But that is comparing to a brutal 2018 for the 905. In fact, the region surpassed the full year 2018 sales figure of 47,563 sometime in October (it's now sitting at 52,904 YTD November).
It appears a lack of inventory is also a huge factor. In the 905 there were 3,400 less active listings at then end of November as there were last year - which is 30% less. So the region had 20% more sales and 30% less inventory, so that's a lot of market tightening compared to last year. (I mentioned market tightening in my October results blog.) In fact, things are so tight that the Sales to New Listings Ratio (SNLR) jumped from 65% in October to 82% in November. And the jumps are even larger when compared to last year:
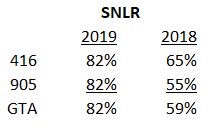
The higher this figure, the more of a seller's market it's considered to be (below 40% = buyer's market, 40-60% = balanced, above 60% = seller's market). To give some context to the 82%, the legendary wild first quarter 2017 went 70% in January, 81% in February, and 70% in March. So yeah, it's higher than the 2017 peak. They way TREB counts new listings taints this stat so I much prefer months of inventory to get a more accurate handle on market velocity, but still this is notable.
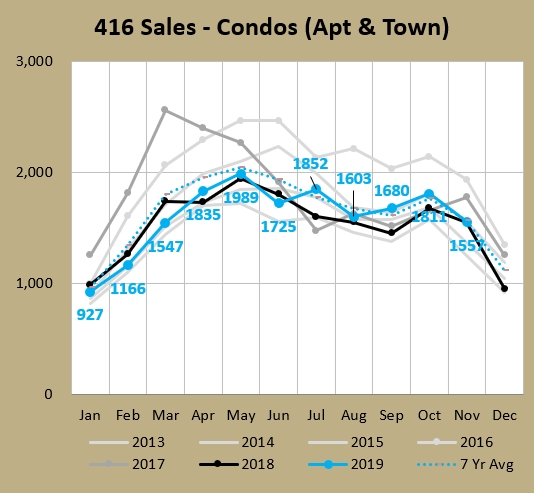
2) Condos are hot
416 Condos are hot right now. I don't say this in a celebratory sense, but a factual one: pretty much all the stats you look at show this.
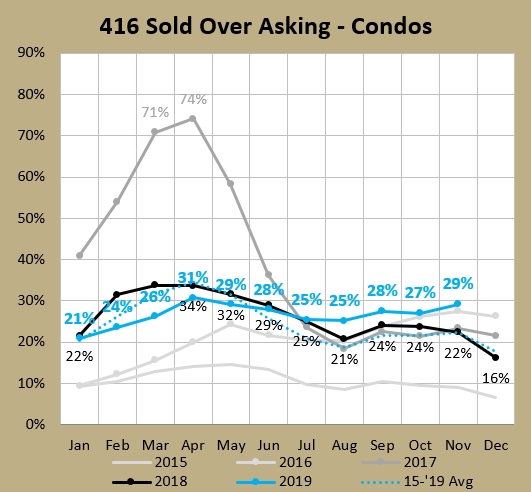
Sold over asking has set new monthly records in each of the last 5 months, with November's 29% being 7 percentage points clear of this time last year.
Days On Market (DOM) are near historical lows (20.9 for November, which was just off the historic low of 20.6 set in 2016). Average prices are up 10% over last year. Heck, even the more sane Home Price Index (HPI) is showing an 8.2% increase for condo apartments. Months Of Inventory (MOI) just posted a 1.3 which is the second lowest November ever (again behind the record sales volume year of 2016) and has now been below 2.00 for 42 of the last 42 months (a very long time to sustain a historically low number).
But the crazy thing is it's this hot without high sales volumes. In fact, the 1,557 were equal with last year (a whopping 3 more) and were 1% below the average of the last 7 years.
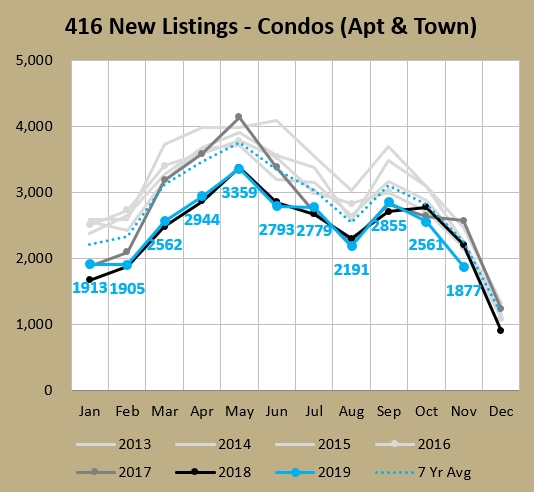
So what's driving this? A lack of inventory. As you see below, there were just 1,877 new condo listings last month. You can see it's the lowest November in recent years, and it comes in at 17% below the 7-year average. But you have to go all the way back to 2004 to find a lower number (1,851). And it's even the first time under 2,000 in the last 15 years.
Switching to active listings (snapshot at the end of the month), it's the same dire story. The 1,994 listings you see in the chart below are the lowest November since 2001 (1,993) - when there were just over 100K apartments in the 416 condo universe, compared to 279K in 2017 (per the CMHC). This has been a problem since the early 2016, where you can see below how the active listings break off from the seasonal patterns and dive right down.
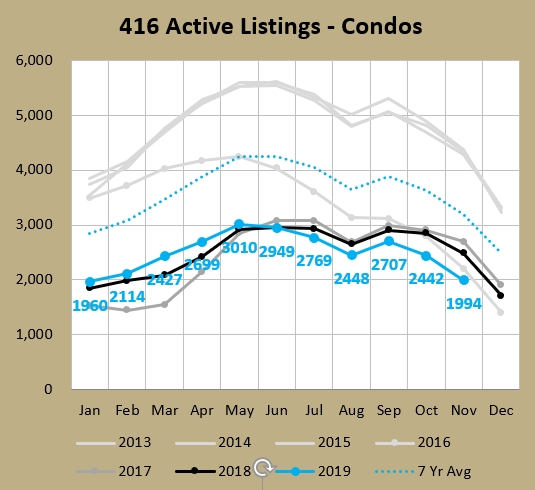
The first few months of this year showed some promise, as they were higher than 2017 and 2018 numbers, but in the last 5 months they've ducked below. The whole year the numbers have been sitting around 30% below the 7-year averages (-29% to -33%) but in November that dropped to 38% below. That translates into about 1,200 less listings than the November average (which is already dragged down by the recent 3 years). You've got at least the same amount of people looking at condos (average sales), but 38% less units available for them to buy. So that's going to drive up competition, which in turn drives up prices. If I look at the 5 years prior to 2016 as the standard, the average November had 4,361 active listings, so there were nearly 2,400 less listings, or another way, less than half of what there used to be.
3) What is causing this condo craziness?
That's the million dollar question (or $660,208, which is the average price of a 416 condo). There are some demand factors in play, with large population increases and low interest rates. Also, given how much prices for lowrise have gotten away from many buyers, that could be bringing more eyes into this space, as people that can't afford lowrise are forced into the condo market if they want to buy. There's a saying about "Drive until you qualify," meaning people are heading farther out to the suburbs until they can find a place with prices they can afford. Maybe it could be "Downsize until you qualify" as a 1,200 sqft starter home has turned into a 500 sqft condo for some. But with sales running at average levels, I don't think the biggest factors are demand-related, so much as the inventory problems I've noted above.
Here are three possible contributing factors:
- Pre-construction Investors - These people have bought a ton of studio and one-bedroom apartments as investment properties and are currently leasing them out. They bought at the right time and have seen a large run-up in their prices so are content to hold on. I don't have historical stats to show that the rates of landlords are going up but anecdotally that's definitely the case. Statistics Canada indicated that 37.9% of Toronto condos are not owner-occupied. Near the core it's not uncommon to have buildings with over 50% rental units. I saw one building last year where the rental percentage was a whopping 90%.
- Backdoor Investors - These people bought a condo (pre-construction or not) to actually live in themselves ("end user"). Now their stage in life has changed and they have a partner, or have a partner with a kid on the way. In any event they want to move up to a bigger place. In years gone by people would "trade up" by selling the condo and using that built up equity to buy a house. Now what I'm seeing is that my last several condo owners that moved up to a bigger space are electing to keep that condo "as an investment." Statistics Canada are now 359,475 multiple property owners in Toronto. I can think of a couple of condo owner friends that moved out of town. In years gone by they would've sold when they packed up and moved. These people have elected to hold onto their condos and manage them from afar.
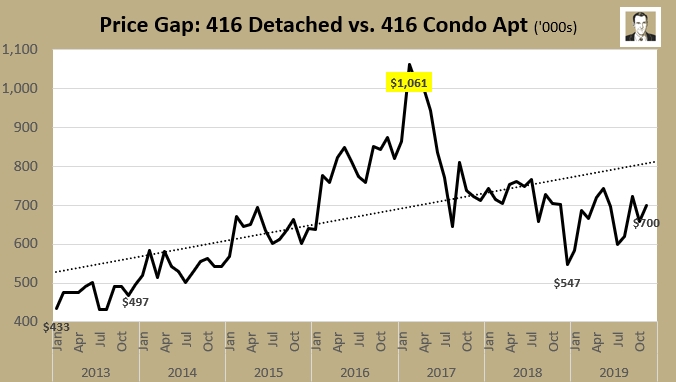
- Staying put due to price gap - The price gap between a 416 condo apartment and a 416 detached house is currently $700K (see below). The last time it was under $500K was December of 2013. Yes, almost 6 years ago! I don't think it's the "Canadian Dream" to live in a glass box in the sky. I think most people would prefer to live in a detached lowrise house if money was no object. But money is an object and maybe that's forcing condo owners to stay put.
All of these factors would inhibit the historical natural turnover of condos and lower the number of condos available for sale (i.e. active listings). I think this is a much bigger factor with condos than houses because it's definitely easier to put $100K down to buy a $500K condo than scrape up $200K to buy a $1 million house. Plus the rent you'd get from owning two $500K condos will likely be more than you'd get out of that $1 million house. If we could see numbers on all three of these factors, I'd bet they have all intensified since 2015 (the last year 416 condo active listings were "normal").
As always, you will find the full set of market charts (for this month, and for archived prior months) on my SlideShare.
About Scott Ingram CPA, CA, MBA
Would you like to make better-informed real estate decisions? I believe knowledge is power. For that reason I invest a lot of time researching and analyzing data and trends in the Toronto real estate market. My Chartered Accountant (CPA, CA) side also compels me to perform a lot more due diligence on properties my clients are interested in purchasing. If you have better information, you should have less risk and be in a position to make better decisions for your hundreds of thousands of dollars.
Your home is the single largest investment you'll make - trust it with an accountant.
Post a comment