

With real estate statistics, the most common comparison is straight-up year-over-year comparisons of actual numbers (e.g. May 2018 vs. May 2017). TREB has also increasingly been mentioning the Home Price Index ("HPI") and Seasonally Adjusted ("SA") numbers. And people are skeptical of them. I know I was skeptical about them too because they are calculated in a mysterious black box and we don't know what numbers go in there and how they do things. TREB is so biased that people have an inherent distrust that they're manipulating the data.

Illustration credit: www.vecteezy.com
So as I did for my HPI explanation post, I've had a lot of emails and a few phone calls back and forth with the helpful people on the statistics team at CREA over the past couple of months to get a better handle on what goes into their Seasonal Adjustments. I'll share with you the answers I got to my questions. [Update - CREA has provided actual adjustment figures, posted at the bottom]
TREB and its spin
First, let's talk about the Toronto Real Estate Board ("TREB") and why I (and many others) are skeptical of their numbers. They have traditionally reported their monthly results with a comparison to the prior year, e.g. "May 2018 sales were 5% higher than May 2017." However with the beginning of 2017 being really hot for sales and the beginning of 2018 being slow, year-over-year (YoY) comparisons were starting to look ugly this spring. Take a look at how average prices looked at April this year compared to 2017 (this is just 416 freeholds):
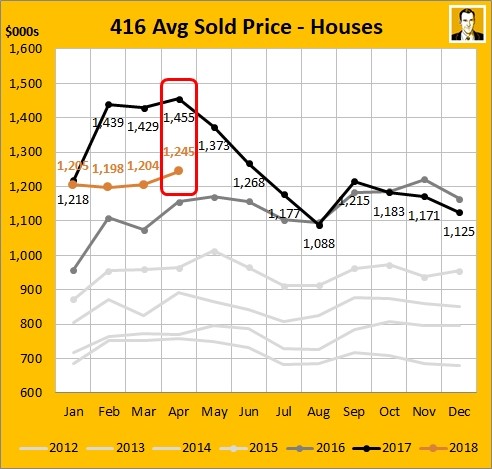
On a GTA-wide basis (for all housing types), here are TREB's April 2018 results on a GTA-wide basis:
sales were down by 32.1 per cent and the average selling price was down by 12.4 per cent.
Not pretty. Before we go further, understand that an important function for TREB is to function as a lobby group for its 51,773 (as of May 2018) members. TREB's motto is "Serving Greater Toronto REALTORS" and it sees its mandate as making sure GTA real estate looks as rosy as possible so that buyers and sellers continue to have confidence in the market and so lots of transactions keep happening (for which realtors get paid a commission) and prices go higher (which pushes commissions higher).
So if actual YoY comparisons aren't looking good, what is TREB to do? Use another measure, of course! From the same April results report:
the MLS® HPI Composite Benchmark was only down by 5.2 per cent year-over-year versus 12.4 per cent for the average price.
Getting better if you use the Home Price Index! (I actually think it's a good measure.) But these numbers are still down. So what is TREB to do? How about month-over-month (MoM)?
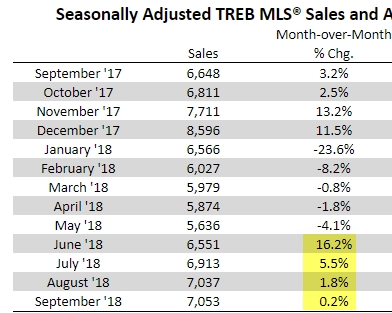
After preliminary seasonal adjustment, the month-over-month change (i.e. March 2018 to April 2018) in sales and the average selling price was minimal, with sales decreasing 1.6 per cent and the average selling price decreasing by 0.2 per cent.
Better still! So they go from prices being -12.4% to -5.2% to -0.2%. Too bad it's still negative, but there's not much they could do there (though they really tried). So what they're doing now is taking 3 different measures and picking the most favourable one to emphasize every month. Or at least letting you know, this is bad, but If we look at it this way, it is less bad!
What is the purpose of the Seasonal Adjustment?
So back to the SA and why TREB uses it. Mainly it's trying to give you a tool that you can compare one month to another month in the same year, by leveling the playing field. Here are 416 freehold sales for the last several years:
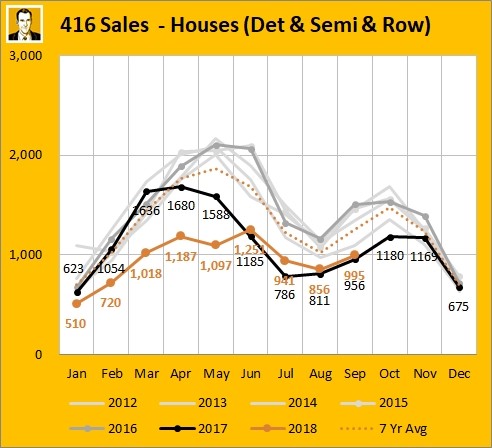
As you can tell by the peaks and valleys, it's a very seasonal business. May is going to always have more sales than February, and October will always have more than December. The average month from 2012 to 2017 had 1,331 sales transactions. The high in those 72 months is 2,166 (63% over the average) and the low is 623 (53% below the average). I'm showing freehold sales here, which are more seasonal than condos, but freeholds make up 60-65% of GTA transaction volumes (62% in 2017).
Here's a chart TREB put together for the last 10 years with GTA-wide numbers where you can also see the annual ups and downs, which make a "sawtooth" pattern:
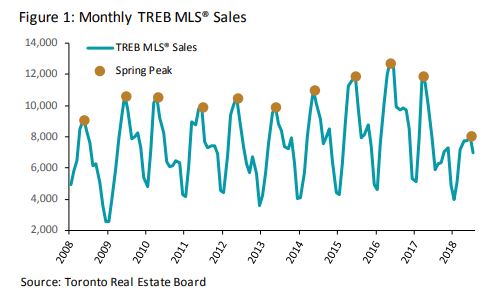
As TREB puts it, "how do we discuss changes in sales from one month (or quarter) to the next and determine how much of that change is due to the regular seasonal pattern versus a change in market conditions?" And that's what the Seasonal Adjustment ("SA") attempts to do.
I look at it kind of like a golf handicap.

Photo by Erik Brolin on Unsplash
The purpose of the golf handicap is to "allow players of different proficiency to play against each other on somewhat equal terms." So somebody that normally shoots 95 can closely compete with somebody who normally shoots 75. In our case, a month with high sales like April will get adjusted down while a slow sales month like January will get adjusted up to level things out. With these adjustments, the theory is you can make better comparisons between April with January (where January might actually come out ahead).
The 6 adjustment factors
So this is the mysterious part. Again, thanks to the statistics team at the Canadian Real Estate Association (CREA), who were extremely helpful and patient with my many questions. CREA is the go-to here as they supply TREB with the numbers. Each of TREB's SA charts has this annotation: "Preliminary seasonal adjustment undertaken by the Canadian Real Estate Association (CREA)"
It's a good time to point out that these adjustments are based on a lot of historical data ("ideally 10 to 15 years") with an emphasis on the most recent 3 years. And note that CREA got their model from Statistics Canada, Here are the 6 factors that will bump a month up or down:
- Seasonal factor (high volume or low volume month) - this is the most significant weighted factor by far. The months with the largest adjustment are December and January (both bumped up) [update - see chart at bottom with actual figures]
- Trading days - this is a maximum +/- 5% adjustment for a single month (it's usually less). More transactions happen on weekdays than weekends. An extensive multi-year study found Monday to Friday each had 17% or 18% of the week's transactions, while Saturday was 9% and Sunday was 4%. Each month has at least 4 of each day of the week. It makes a difference whether the extra 2 (or 3) days are a Tuesday and Wednesday or a Saturday and a Sunday. The minimum you could have is 20 weekdays (like September 2018), and the maximum is 23 (August 2018), so some adjusting has to take place. This May had 23 trading days and was adjusted by -3.7%, while June had 21 trading days and had a +0.9% adjustment. [update - see note at bottom with actual figures]
- Holiday component - A holiday would act more like a Sunday than a Wednesday, so there's an adjustment for that (similar to trading days). The only holiday in Canada that could move months is Easter, between March and April. December has 2 holidays, and the other months are 1 or 0. [update - see table at bottom with actual figures]
- Leap year - Obviously some Februarys have one extra day, which must be accounted for.
- Forecast adjustment - From CREA, "The model then also produces a forecast out to the end of the year and makes an additional tweak to make sure the seasonal adjusted trend is on track to sum to the forecasted annual unadjusted total." So if the 2018 forecast was 80,000 last month and 81,000 this month then all the numbers are adjusted to fit that new total.
- Provincial adjustment - From CREA, "Lastly, all local market data is slightly tweaked so that the numbers for all local markets in a given province add up to the result of directly seasonally adjusting the provincial total." This is what TREB is referring to with the "preliminary" comment above. The TREB number comes from CREA, but it's provided on the first business day of the month, so CREA hasn't done the data for all of the other Ontario markets yet. This preliminary number supplied to TREB could be slightly different than the final CREA number.
How do these numbers shake out?
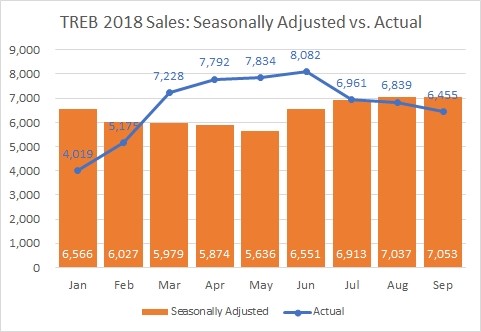
So what do these adjustments look like using real numbers? Here we go. The "Actual" column uses the GTA sales figure as originally reported in that month's Market Watch release (the months get tweaked up or down a few transactions as the year goes by and transactions are sometimes reclassified or reported late - but the original Market Watch never gets restated). The "Seasonally Adjusted" column is as the numbers were reported in the press release of September numbers.
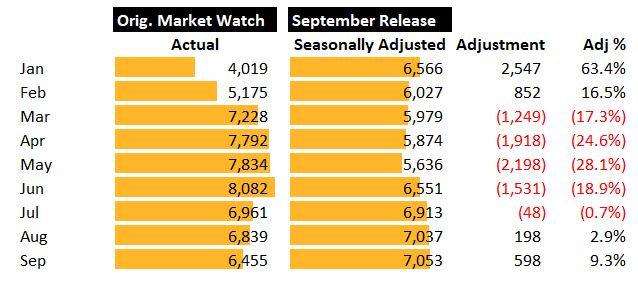
You can see the month with the biggest boost was January (+63%) and the biggest downward adjustment was in May (28%). These include all factors, not just factor #1 (seasonal factor). So you can tell these SA numbers are much more smoothed. The difference between the highest and lowest in the Actual column is 4,063, while in the SA column the spread is only 1,401. Here's how they look overlaid:
One thing I'd noticed was that the historical numbers get adjusted from month to month. For example, in the August stats release, the August SA number was 7,093. Now in the September release, it's 7,037, or down by 56.
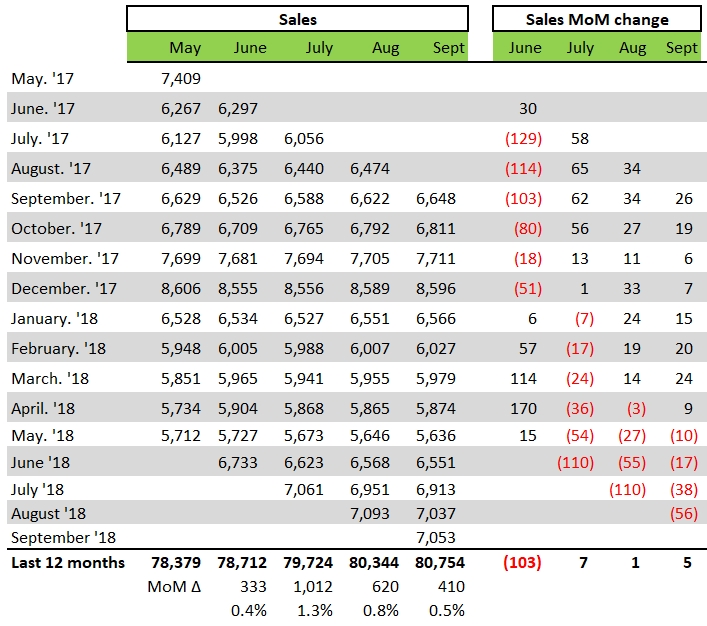
A major reason for that is one month represents "a portion of the projected annual total." And as you see, the projected total has been slowly increasing in recent months. This is factor #5 above (forecast adjustment). Seems a bit weird to me that the most recent months keep getting adjusted down, though. August changing from 7,093 to 7,037 sure did help September maintain the streak of 4 months in a row of month-over-month increases.
Example of a big month-to-month change
One of the big claims for the usefulness of trying to compare month-over-month is to be able to see "turning points" in the market. A look back in the last year shows a great example:
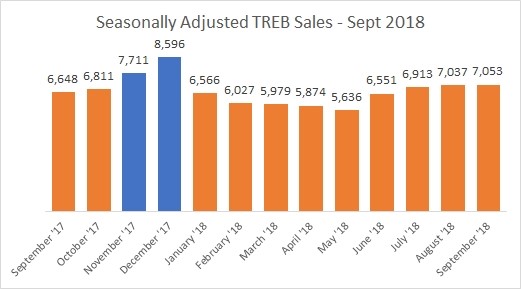
What's up with November and December 2017, which suddenly got a lot hotter? Well OSFI B-20 (the stress test rules for uninsured mortgages) was announced on October 17, 2017, to kick-in on January 1, 2018. These seasonally adjusted numbers appear to show what many, including myself, had talked about with a "pull-forward of demand" in the last couple of months. That is, people that might've transacted in early 2018 instead bought a place in November or December in a rush to beat the implementation of the stress test rules. So that's exactly the kind of stuff this is supposed to show us. The average across these 13 months is just over 6,700 sales a month, so you've got nearly 3,000 extra sales in Nov and Dec. So it's no wonder the first half of 2018 averaged about 600 sales a month lower.
Funny but TREB didn't mention anything about the pull-forward with the November results. And in December they mentioned it, but sounded reluctant about it:
some buyers arguably brought forward their home purchase in response to the new OSFI stress test guidelines
But that was before TREB was talking about seasonal adjustments in their monthly press releases. They didn't start that until the April 2018 results, and they didn't start showing the SA numbers table until May results.
But I still don't like it because it's not transparent!
From my auditing days at Ernst & Young, I still carry a "healthy skepticism" so believe me, I hear you. But honestly, I have more confidence in it after I dug into it. That's due to four main reasons:
- It's Statistics Canada that developed the model
- It's CREA and not TREB that calculates it
- From my conversations, it's evident that smart people are running the numbers
- I have a much better understanding of it now
I still don't know all the ins and outs, but I definitely have more confidence that it's not a load of crap. As far as being able to rely on its value despite not having all of the calculations in front of me, I think of an example from baseball. There's a statistic called Wins Above Replacement (WAR). New school statistically-inclined people tend to like it. Old school people (think the scouts from the Moneyball movie) don't. There's a good article from one of the two main websites that calculates WAR, where they answer "How can we trust it when I can't calculate it?" In short, they liken WAR to GDP, and mention that the people who use and rely on GDP (news media, politicians, business owners) don't have any prayer of calculating it, but still rely on it, trusting the subject experts to calculate it.
That's where I'm at. I've warmed to it, and think it has some use as one data point.
Post update: New data from CREA!
The statistical department at the Canadian Real Estate Association was nice enough to pass along the actual numbers for the three largest adjustment factors to me, and nice enough to allow me to share them with you. I've put them in a graph to help you visualize, but note the months average out to 100, with a low number (e.g. January) needing to be grossed up to reach 100 and high number (e.g. May) needing to be adjusted down to 100, so that they're all on the same basis. Here are the three largest adjustment factors:
1. Seasonal factor - these numbers are taken from results over the last 18 years:
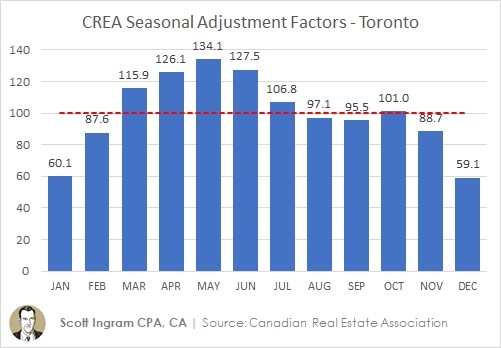
The formula here is "Raw sales x 100 ÷ Factor". Let's take a raw (actual reported) number of 6,000 and see what happens.
February: 6,000 x 100 ÷ 87.6 = 6,849
March: 6,000 x 100 ÷ 115.9 = 5,177
So though the actual sales were the same in each month, by doing the adjustment, you can see that 6,000 was a good result for February when compared to March.
2. Trading days - to equalize the amount of non-weekend and holidays in two months.
Maximum: 103.9
Minimum: 95.3
So the most you would have to adjust up or down is in the 4-5% range
3. Holiday component - The Easter holiday effect only applies to March and April and here are the boundaries:
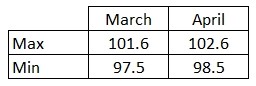
So the most you would have to adjust up or down is in the 2.5% range
Further reading
I've been meaning to write this blog post forever. I started researching it in July, but I kept being too busy to get to it. Back then, TREB hadn't issued anything guidance on Seasonal Adjustments, so I was looking at this post as filling a void. So of course by now they have finally issued "A TREB Primer on Seasonality and Seasonal Adjustment." It's not as detailed as this post (nor as snarky towards TREB), but I think it would be a good review after reading this.
About Scott Ingram CPA, CA, MBA
Would you like to make better-informed real estate decisions? I believe knowledge is power. For that reason I invest a lot of time researching and analyzing data and trends in the Toronto real estate market. My Chartered Accountant (CPA, CA) side also compels me to perform a lot more due diligence on properties my clients are interested in purchasing. If you have better information, you should have less risk and be in a position to make better decisions for your hundreds of thousands of dollars.
Your home is the single largest investment you'll make - trust it with an accountant.
Post a comment