
February 2019 charts: TREB wants a boost after another poor sales month
Wednesday Mar 06th, 2019
Here's your Toronto real estate market report for February. Another slow month has TREB campaigning for changes to boost sales.
Below is what I saw in the February stats. As always, these are just selected highlights. The full set of market charts is available on SlideShare.
1) February should've been better
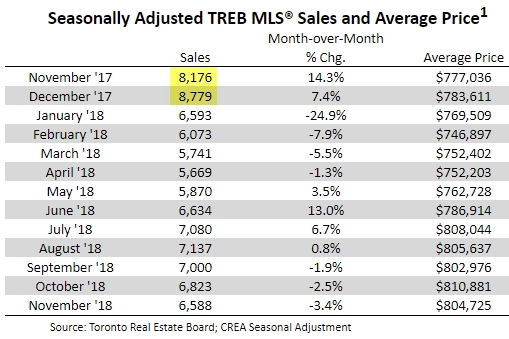
I took the same title for a point in January and changed the month: the same story. You all know the big hullabaloo over the stress test on insured mortgages (20% down or more) that came into effect on January 1, 2018 and got a lot of blame for the slow year last year (77.4K GTA-wide transactions for the year, 16% below 2017's number, and the lowest year since 2008). Well, November and December 2017 had a lot higher sales than they would've normally because people were rushing to beat the stress test. So 2018 started out low in the first couple of months because some of those transactions were pulled ahead into 2017. You can really see it being pulled forward when you look at how high the Nov & Dec numbers are below:
So if things just returned to "normal" this year, I would've thought Jan & Feb 2019 transactions should've been higher than last year. So the fact the January 416 sales were down 6.0% and February was down 6.3% is interesting.
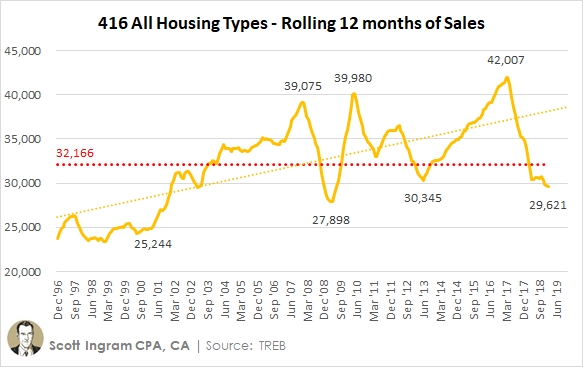
Rolling 12 months of sales for the 416 edged down again and is yet another month that's at the lowest level since February 2009 (and below the 24-year average).
So here is what I mean about TREB campaigning for changes to boost sales (and make its realtor members more money). These quotations are from the Press Release that accompanied the February results. First, it's that dastardly stress test:
"The stress test should be reviewed and consideration should be given to bringing back 30-year amortizations for federally insured mortgages. There are a federal budget and election on the horizon. It will be interesting to see what policy measures are announced to help with homeownership affordability"
Next, TREB is warning us about the evils if you don't go out there and buy a house. It's your civic duty!
“Home sales reported through TREB’s MLS® System have a substantial impact on the Canadian economy. A study conducted by Altus for TREB found that, on average, each home sale reported through TREB resulted in $68,000 in spin-off expenditures accruing to the economy. With sales substantially lower than the 2016 record peak over the last two years, we have experienced a hit to the economy in the billions of dollars, in the GTA alone. This hit has also translated into lower government revenues and, if sustained, could impact the employment picture as well”
And now, since condos have been showing signs of weakening, we're reminded to go out and invest in a condo. If you want to be a good citizen, do it for the good of those unfortunate renters!
“With vacancy rates hovering in the one percent range and average rents increasing in the high single digits, it is clear that signing a lease for a rental unit is not an easy proposition in the GTA. While some rent control provisions have been relaxed by the new provincial government, policymakers need to look at further initiatives to encourage rather than discourage investment in rental apartments.”
I wish they'd turn down the self-serving rhetoric, but really they're a 53,000 member lobbying group.
2) Condos still showing slowing
As mentioned above, condos are showing signs of weakening. I've been writing about weaknesses showing in this part of the market (which was 61% of 416 transactions last year), since December results. I've been saying it's something to monitor, so here I am monitoring.
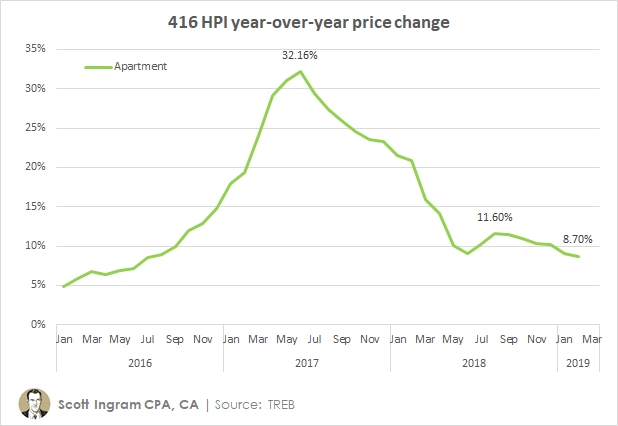
The annual price gains on condos have decelerated in the last 3 months, from 11.7% in December to 10.6% in January to 5.8% in February. That might mean nothing since Sep/Oct/Nov went 11.8%, 7.8%, 6.8% before jumping up to that 10.6% in December - but it's a little clearer when you look at the HPI (which strips out a lot of the noise with using average prices). It shows the benchmark condo apartment price falling for 6 months in a row now, from 11.6% in August to 8.7% last month.
One weak sign is that Feb sales were one of the smallest of the decade (finishing 8th of the 10 years). And this is as a lot of new condo inventory has been built.
Actually, 20 of the last 22 months were lower than the prior-year (for the same month). While overall 416 volumes were down 6.3%, it was lower in condos (7.4%) than it was for freeholds (3.6%). As you see above, February sales rolled back about 5 years, being the lowest since 2014.
But it's hardly a catastrophe. Sales are low, but inventory is still at crazy-low levels, one-third lower than the average of the last 7 years:
So that's keeping months of inventory (MOI) low, which means prices are likely to keep rising (remember, I didn't say prices are falling - just that the rate they're rising has slowed).
3) Did the "February bump" happen?
February generally sees a large bump in average prices, which I call the "February bump." I wrote about it here. In the prior 23 years, Feb freehold prices increased an average of 8.5% over Jan prices, and 21 of the 23 years have increased. Last year (-0.6%) broke a 21-year streak of gains. So what happened this year?
The average 416 freehold price increased by 9.1%, slightly above the average (8.5% still) and median (8.9%).
4) Detached/Condo price gap
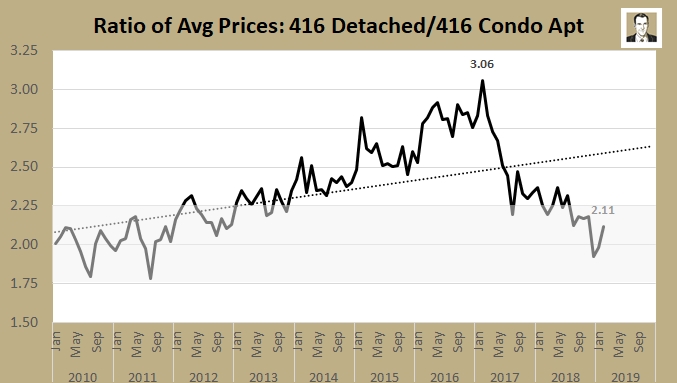
I've added a new chart to the monthly set. This is something I've been tracking periodically, but I'm going to try it monthly now. For a long time, all the way from 1996 to 2012, the ratio in prices of a 416 detached house and a 416 condominium apartment was right around 2. The average in that period was 2.01 and the median was 2.01. It pretty much stayed +/- 0.25, with 98% of those 204 months falling within that range, and the minimum being 1.72 and the maximum being 2.31. I've put grey below in the 1.75 to 2.25 zone:
You can see the 2010-2012 numbers in the grey zone, then watch as they took off upwards as detached price growth severely outpaced that of condo apartments, leading up to a peak in the ratio of 3.06 in February 2017. For the five-year period of 2013 to 2017, the average was 2.53, and the lowest was 2.19 (near the top of the grey zone).
I think it's noteworthy that the last 7 months (and 11 of 13) have been back in that old "grey zone." And the Dec & Jan numbers actually ducked below 2.0, which was the first time since August of 2011.
The gap isn't small now since all prices are elevated (it's sitting at $682K in February), but it has shrunk by a whopping $378K in the last two years. That coincides with the peak dollar gap of $1,061K in February 2017. The average for the last 3 months is $605K. A three-month period hasn't been that low since Dec 2014 to Feb 2015. All good news if you wanted to trade up to a house from a condo.
As always, you will find the full set of market charts (for this month and prior) on my SlideShare.
► To share this post or to add your comments, scroll down a bit below.
About Scott Ingram CPA, CA, MBA
Would you like to make better-informed real estate decisions? I believe knowledge is power. For that reason I invest a lot of time researching and analyzing data and trends in the Toronto real estate market. My Chartered Accountant (CPA, CA) side also compels me to perform a lot more due diligence on properties my clients are interested in purchasing. If you have better information, you should have less risk and be in a position to make better decisions for your hundreds of thousands of dollars.
Your home is the single largest investment you'll make - trust it with an accountant.



.jpg)
.png)


Post a comment