

The MLS Home Price Index (HPI) is designed to act like the more familiar Consumer Price Index (CPI). While the CPI tracks the price of a basket of goods, the HPI tracks the price of a basket of house attributes. For a more detailed look into how the HPI works, check out this blog post. It's been a long time since I've posted the HPI charts, but with 2018 just ending I thought it would be a good time to share a look-in. Note, I zero-in on just the 416. Different parts of the wider GTA can and do act differently.
Similar to my monthly Toronto real estate market charts, I make my full set of HPI charts (with the charts much larger and more legible) available as a SlideShare report.

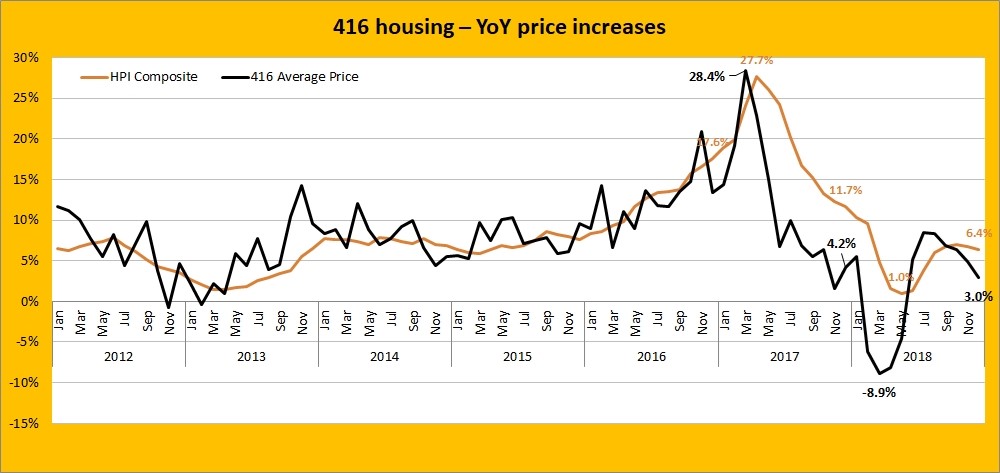
HPI isn't as volatile as average prices
That is one of the benefits of it. Here's a comparison with the 416 average price (which takes into account all 416 housing types, which is about half condo apartment sales). This month the HPI composite kept declining, despite an uptick in the 416 average property price.
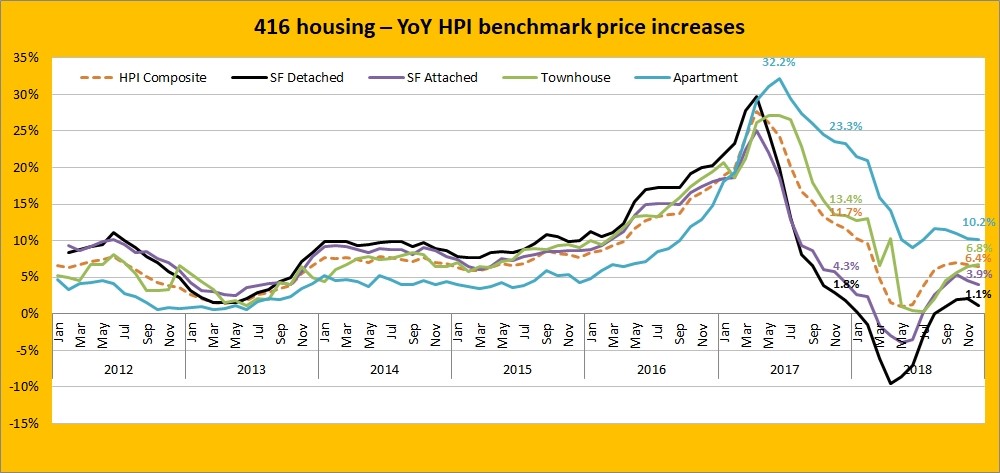
How do the indexes compare across housing types?
The composite index is made up of constant weights of 4 different benchmarks. As you'd expect, the composite index lies in between the highs (condo apartments) and lows (single family detached houses).
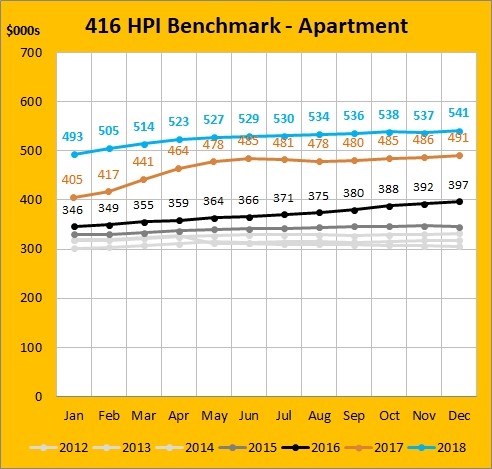
Condo apartments: cause for concern?
This segment (55% of transactions in the 416) was the strongest performing in 2018. It averaged being $52K above the 2017 numbers during the year. It's also the largest gainer in the last two years, being up $144K over the December 2016 number. That despite being the lowest-price housing type.
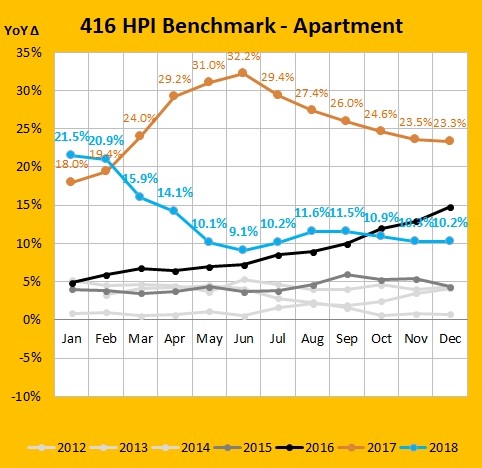
The concerning thing to me is the year-over-year (YoY) price gains. For 26 of the last 27 months it has been 10% or higher. I don't see that as a sustainable rate.
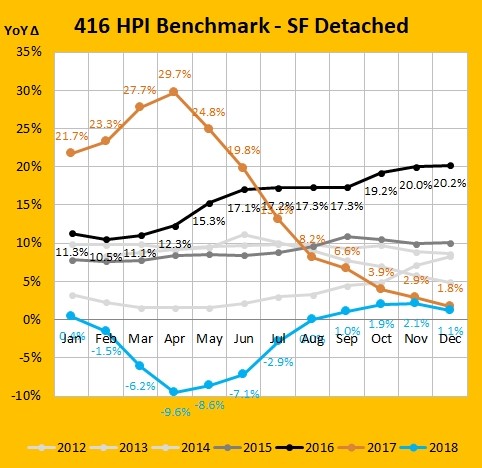
Detached has flattened out
This segment suffered the largest drop-off from Spring 2017 peak prices, falling 10% ($129K) in just 3 months after May 2017.
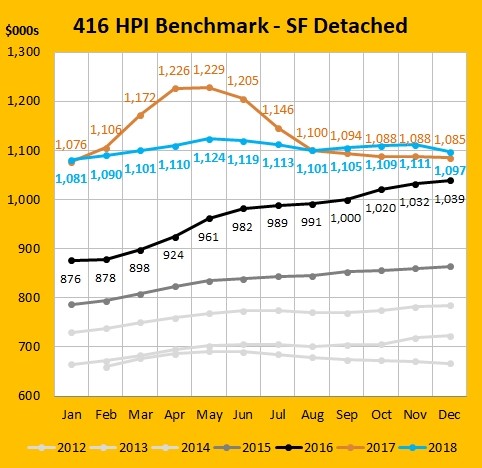
But you will note that since that time, prices have remained very steady. They have remained at $1.1 million +/- $25K for 17 months from August 2017 onwards. That's what I would call stabilized. There were a lot of ugly YoY comparisons in the spring but I look at it like in Feb 2017 it was at $1,106K and then at August it was right down at that level again. The quick spring spike was handed right back. It's not like the decline rolled things back 3 years - they rolled back 6 months.
Like I said, it's been flat since August 2017, so you're seeing that below in the blue line in the last 5 months of the year (and you're also seeing the ugly 10% decline in April I mentioned). So we're at the lowest YoY increases (and only decreases) since HPI figures were published in 2012.
It's important to remember that these are the "benchmark" homes. Ones with the most common, or median attributes. Just like an average you're going to find higher and lower figures. So the fact the benchmark is up 1.1% doesn't mean some houses didn't gain more or lose more. Using the benchmark strips out the outliers, the $10 million Bridle Path mansions, etc. As I mentioned in my December 2018 charts, GTA sales of properties worth $1.5 million or more were down 40%. That's going to drag down the average as those properties make up a smaller percentage of the mix, but it won't harm the benchmark.
The above charts (larger size - especially the first 2 on this page), along with the equivalent charts for all the other housing types, and further analysis are available on the SlideShare report.
About Scott Ingram CPA, CA, MBA
Would you like to make better-informed real estate decisions? I believe knowledge is power. For that reason I invest a lot of time researching and analyzing data and trends in the Toronto real estate market. My Chartered Accountant (CPA, CA) side also compels me to perform a lot more due diligence on properties my clients are interested in purchasing. If you have better information, you should have less risk and be in a position to make better decisions for your hundreds of thousands of dollars.
Your home is the single largest investment you'll make - trust it with an accountant.
Post a comment