Despite the headlines you'll see below. no it's not. Vancouver is — but the gap closed a little in Q3 according to a new RBC report on Housing Trends and Affordability. However, one Canadian daily newspaper looked at the same report and came up with the headline:
"Toronto eclipses Vancouver as country's least affordable housing market"
Then the article opened with "Toronto's screaming real estate prices have made it the least affordable market in the country, with the relatively scarce supply of detached housing one of the leading stressors, according to RBC." The headline (which is usually not written by the author) and lede were blatantly wrong that I took it upon myself to email a correction, as there is enough hype and sensationalism about the Toronto market already, so nobody needs any false information making it worse.
A prominent Toronto blog ran a similar headline:
"Toronto is now Canada's least affordable housing market"
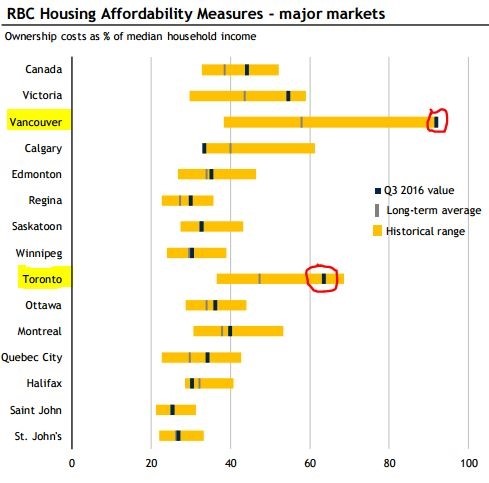
Here is a chart straight from RBC's report that refutes those erroneous headlines in a second:
So what happened in Q3?
The misinterpreted piece of news was that Toronto's number grew more (+3.0%) in Q3 2016 than Vancouver's did (+2.2%). Note for all of the RBC figures they mean the Toronto Area and Vancouver Area (i.e. GTA and Metro Vancouver), so for this blog post I will do the same. That was the "first time in almost two years" that Vancouver wasn't growing at the fastest rate. That's all. The 3.0% increase in the quarter was Toronto's largest quarterly surge in more than 22 years. The 63.7% figure Toronto stands at is the highest it has been since it's peak (the furthest to the right of the gold bar) 26 years ago in the spring of 1990. Note these are aggregate numbers, so include all housing types. In the last 12 months, Toronto's aggregate number has climbed 7.3 percentage points ("pp") from 56.4% to 63.7%, which is nowhere near as steep as Vancouver's climb of 17.5pp from 74.5% to 92.0%.
Can I see you on TV talking about this report?
Why yes, you can. Though the segment came about because of the report, and I did discuss the report with the reporter Janice Golding, my edited clips aren't directly on the report. But CTV and the reporter got their facts straight!
How do they calculate affordability?
Let's take a peek at RBC's measure of affordability, "Ownership costs as a % of median household income." The higher the costs, the higher the percentage, and the less affordable the city is.
Ownership costs: mortgage payments (principal and interest), property taxes, and utilities
Income: median pre-tax household income
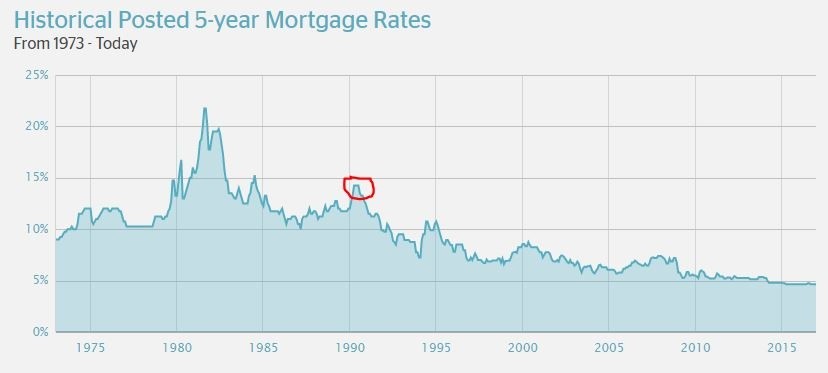
For point of reference, the median "family" income for Toronto in 2015 was $75,270. The biggest driver in ownership costs is mortgage payments. Looking back at that peak in the spring of 1990, the Bank Of Canada 5-year fixed rate was 14.25%. At the end of Q3 2016 it was 4.64%. so current cost increases are being driven more by the amount of the mortgage than the rate of the mortgage. (RBC is using a 25% down payment and a 25 year mortgage at the 5-year fixed rate.)
Using the $75,270 median income (I don't know what RBC used) and a 63.7% aggregate number, that's saying ownership costs average nearly $4,000 a month ($3,996). Breaking it down further, I get monthly costs of roughly $3,075 for mortgage payments, $425 for property taxes, then $500 more for utilities and other.
What about houses versus condos?
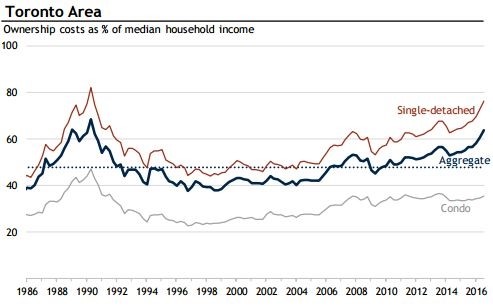
Aggregated or averaged numbers can hide a lot. The Toronto Area chart below shows pretty clearly that is Single-detached homes that are driving the Aggregate number up. The Single-detached number is 76.1%, up 8.9 percentage points year-over-year and 3.3pp for Q3. Meanwhile you'll note the Condo apartment line is a lot more flat. Condos are currently at 35.5%, up 1.5pp over last year. That number is less than 5pp up from the average since 1985 of 30.8% — compared to Toronto Single-detached homes which are 20pp above the long-term average of 56.0%.
What will we see in the Q4 report?
In the middle of Q3 (August 2nd), Vancouver implemented a 15% tax on foreign buyers (acting similar to a land transfer tax). In December, Vancouver announced an Empty Homes Tax, to be calculated at 1% of a property's assessed value, beginning in 2017. These measures, obviously aimed at foreign investors and speculators, appear to have already had an effect on Vancouver-area sales, as transaction volumes in recent months are down versus last year (↓33% in September, ↓39% in October, ↓37% in November), which has led to month-over-month price decreases (November was ↓1.2% from October). So Vancouver's affordability looks to improve in Q4.
Toronto on the other hand remains, in the words of the RBC report, "fueled by a vibrant regional economy, strong demographic flows and continued investor interest". Demand remains above last year's levels while supply is at levels 50%-70% lower than 2015, so there upward pressure on pricing remains strong. So with prices increasing, mortgage payments will increase, and Toronto's 63.7% number will edge closer to Vancouver's.
Three for the road
1. Don't believe everything you read. Interpreting data isn't everyone's strong suit.
2. Be very aware that averages hide a lot (for instance, the National condo affordability figure is 35.6% but that's all Vancouver (45.8%) and Toronto (35.5%) — the other 12 markets are between 21% and 33%)
3. Toronto will continue to get less affordable, while Vancouver looks like it will show as more affordable in Q4
Sources:
http://www.rbc.com/newsroom/_assets-custom/pdf/20161221-ha.pdf
https://www.ratehub.ca/5-year-fixed-mortgage-rate-history
http://www.statcan.gc.ca/tables-tableaux/sum-som/l01/cst01/famil107a-eng.htm
About Scott Ingram CPA, CA, MBA
Would you like to make better-informed real estate decisions? I believe knowledge is power. For that reason I invest a lot of time researching and analyzing data and trends in the Toronto real estate market. My Chartered Accountant (CPA, CA) side also compels me to perform a lot more due diligence on properties my clients are interested in purchasing. If you have better information, you should have less risk and be in a position to make better decisions for your hundreds of thousands of dollars.
Your home is the single largest investment you'll make - trust it with an accountant.


Post a comment