

Here's your Toronto real estate market report for January. It's a slow start for 2019.

Below is what I saw in the January stats. As always, these are just selected highlights. The full set of market charts is available on SlideShare.
1) 416 weighing down the GTA (for a change)
In TREB's January Market Watch report they note "It is encouraging to see the slight increase in January transactions on a year-over-year basis, even with the inclement weather experienced in the GTA region during the last week of the month." Since the market put the brakes on in April 2017, the 416 has been outperforming the 905. Maybe "outperforming" is charitable - it's more like it's been less bad.
But in January, 416 sales were down 5.8% YoY, and 905 sales were up 4.4% YoY, as seen below.
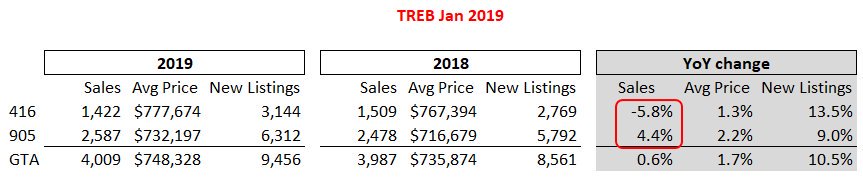
For all of 2018 GTA sales volumes were down 16.1%, but that's 16.7% down in 905 and 15.0% down in 416. Here's the 2018 shrinkage breakdown by region, with 2017 figure in brackets:
City of Toronto -15.1% (-14.5%)
Halton Region -12.8% (-9.2%)
Peel Region -15.6% (-20.0%)
York Region -20.6% (-32.5%)
Durham Region -19.7% (-12.0%)
So maybe 905, and particularly York Region, have stopped their slide. Still not looking great at all, but no longer getting worse.
2) January should've been better
You all know the big hullabaloo over the stress test on insured mortgages (20% down or more) that came into effect on January 1, 2018 and got a lot of blame for the slow year last year (77.4K GTA-wide transactions for the year, 16% below 2017's number, and the lowest year since 2008). Well, November and December 2017 had a lot higher sales than they would've normally because people were rushing to beat the stress test. So 2018 started out low in the first couple of months because some of those transactions were pulled ahead into 2017. So if things just returned to "normal" this year, January 2019 transactions should've been higher than January 2018. So the fact the GTA was only up 0.6% and that the 416 was down 5.8% is worrisome.
I wrote in my December report that "I'm not optimistic about volumes in 2019." The 29,870 transactions in the 416 were the lowest total since July 2009. And now that number has edged slightly lower.
3) Condos worry me more than Freeholds this year
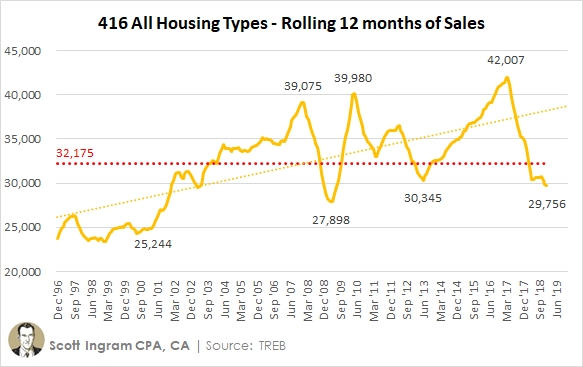
Last year I discussed weak sales in the freehold market frequently. They're still not hot. In fact, January's 484 freehold sales were the worst in the last 24 years (as far back as TREB's accessible monthly information goes back). The rolling 12 months of sales set a new 24-year low too.
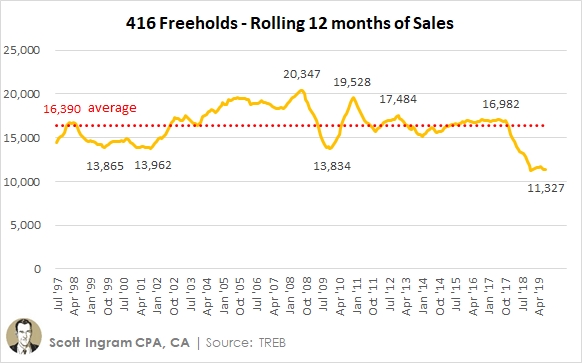
On a couple of important measures, freehold (i.e. non-condo) sales are the worst in 10 years. On some, like sales, 416 freeholds just had the worst year in the last 23 years. But note 416 freehold volumes never really spiked, even in 2016 which was a record year (by far) for transactions in the GTA. If we look at condos on the other hand...
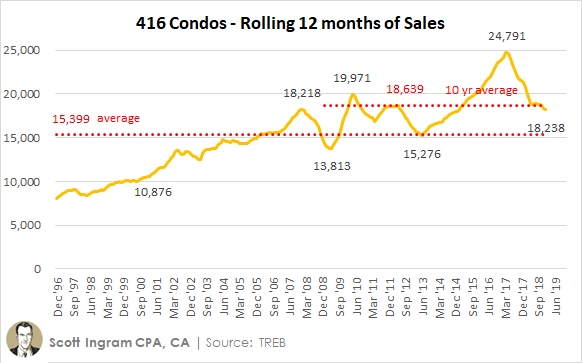
They really spiked in spring 2017, at nearly 25,000 transactions. Now 19 of the last 21 months have had volumes lower than the prior-year and the rolling 12-month number is 6,600 below that peak. When we compare freeholds with condos, condos have dropped the last 3 months after a 6-month stay around 11.8K to 11.9K, white it appears freeholds have flattened out (rolling 12 has been between 11.3K and 11.7K for 9 months). Though it could be a pause like condos had just more sustained.
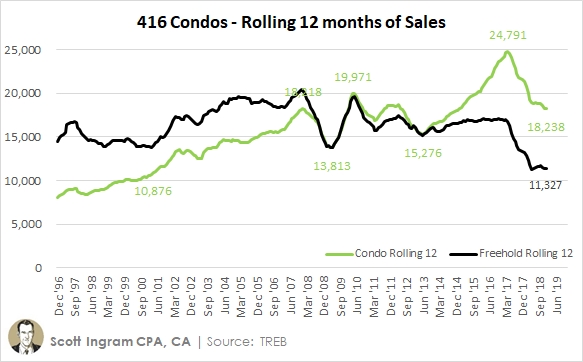
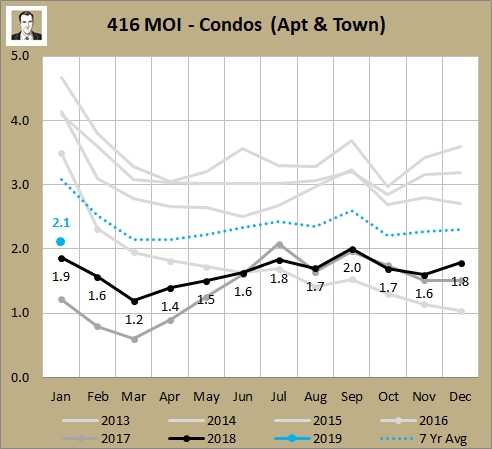
It's not a new observation. The December report had a section called "Condo weaknesses beginning to show." It's just definitely something I'm monitory closely now. One other stat for condos I wanted to show is Months of Inventory (MOI). It was at 2.1 in January. That's still really low historically (a full 1.0 months lower than the 7 year average), but it's only the second time in the last 35 months that it's gone above 2.000. It's also still lower than the freehold MOI of 3.3, a record 23rd month in a row condo MOI was lower than freehold MOI. So it still has a way to go to be a cool market, but it appears to be cooling.
The other thing that makes me think condos have a bit more risk built into them right now is the prices. Have a look at HPI prices across the four housing types they track:
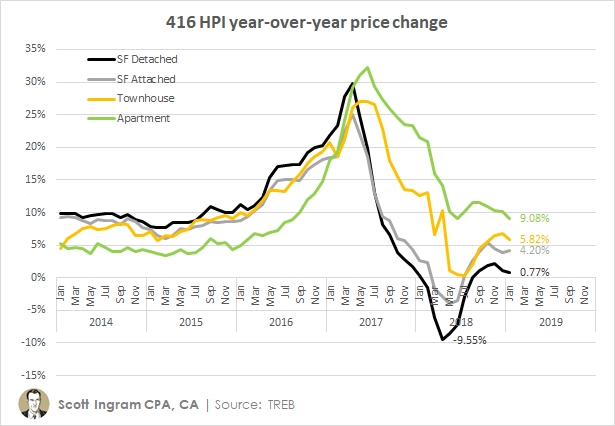
All types reached similar peaks (apartments were 2.4% higher than the next closest, detached, and 7.1% more than the furthest away, single family attached), but when they bottomed out (12 to 14 months after their peaks) the spread was on the way down condos have bottomed out at 9.1%, which is 8.8% different from the next closest, townhouses, and 18.6% better than the furthest away, SF attached. The fact condos have "cooled" to a spot (up 9.1% YoY) that is higher than the 5% YoY it was sitting at before the run-up started in 2016 makes me think there is room for them to decline. I don't think 9% YoY is sustainable. Condo apartments have been above 9% for 29 months in a row now. Single family detached's most recent string above 9% was 24 months.
I'll put it another way... going back one year to last January, condo apartment sales have decreased 6% while average prices have gone up 8%. Going back two years, January sales are 25% lower but average prices are 25% higher. I know this is the most affordable price point and that's what has kept condo apartments buoyant, but that is strange.
4) What's in store for February?
February generally sees a large bump in average prices, which I call the "February bump." You can read about it here. In the last 23 years, Feb freehold prices increase 8.5% over Jan prices, and 21 of the 23 years have increased. The only exceptions were the first year I have monthly data for (1996) and last year (2018), so it broke a 21 year streak. Again, volumes last Feb were depressed due to the pull-forward of stress test beaters, so if Feb sales volumes don't increase YoY then that's bad.
You can read more about what I expect is in store for 2019 here.
As always, you will find the full set of market charts (for this month and prior) on my SlideShare.
► To share this post or to add your comments, scroll down a bit below.
About Scott Ingram CPA, CA, MBA
Would you like to make better-informed real estate decisions? I believe knowledge is power. For that reason I invest a lot of time researching and analyzing data and trends in the Toronto real estate market. My Chartered Accountant (CPA, CA) side also compels me to perform a lot more due diligence on properties my clients are interested in purchasing. If you have better information, you should have less risk and be in a position to make better decisions for your hundreds of thousands of dollars.
Your home is the single largest investment you'll make - trust it with an accountant.
Post a comment