

Here's your Toronto real estate market report for March. Overall GTA-wide sales numbers were flat, but drilling down on that, the 416 was actually down 9% over 2018.

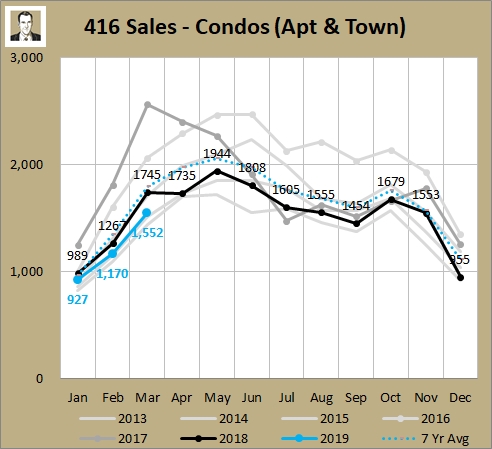
Below is what I saw in the March stats. As always, these are just selected highlights. The full set of market charts is available on SlideShare. This month I'll concentrate on condos (which are 61% of sales volume in the 416).
1) Sales are staying slow
This is the 5th month in a row that condo sales (includes condo townhomes but the total is 90% condo apartments) have been lower than the previous year. And 21 of the last 23 months. But if you consider that before that there were 46 straight months of YoY increases in transactions, it's not too nutty. What goes up, must come down.
I will say, that if you take out the outlying 2016 and first 4 months of 2017, current sales are well within normal ranges. Here are those sales on a rolling 12-month basis.
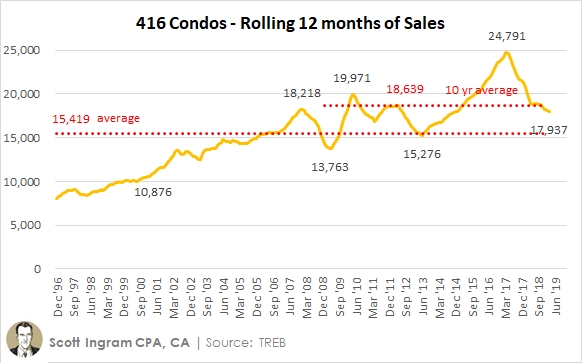
The 2017 peak you see was 24% higher than the prior record peak, so it shouldn't be that surprising that it would drop. Rolling 12 month sales are now below 18,000 for the first time since November 2014. You'll note they are also below the 10-year average. So it's a relatively slow time for condo sales compared to recent years, but still 30% above the trough of April 2009.
2) Condo price growth is decelerating
This is a continuation of a point I made with the February results. I've been talking about this condo weakening since December results.
The annual price gains on condos have decelerated in the last 4 months:
Dec 11.5%
Jan 8.6%
Feb 7.3%
Mar 2.3%
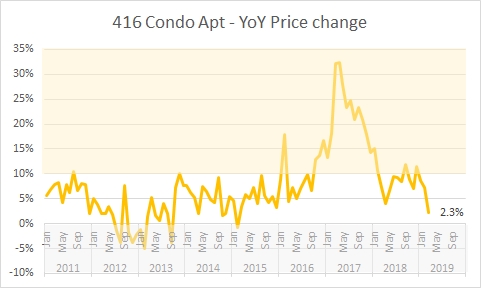
You can see that price growth spends a lot more time in the clear 0 to 10% YoY growth range than it does in the yellow >10% range or the grey <0% range, and 30% YoY price growth is not sustainable and you had to know a regression to norms was coming.
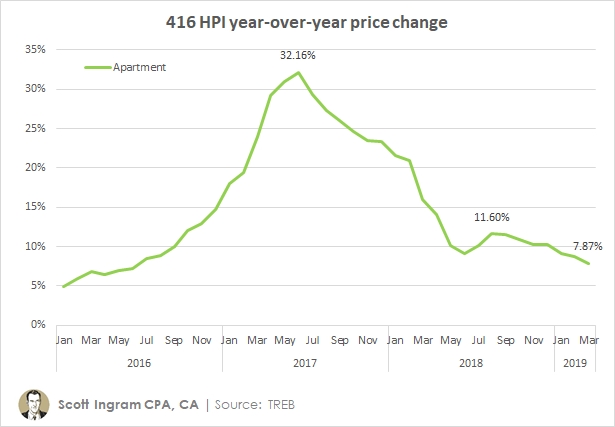
Above are average prices, which are a bit more volatile. For a smoother look, here is the Home Price Index (HPI), which tracks a benchmark condo and intends to strip out a lot of the noise with using average prices. As such, you'll see the line is much smoother. It shows the benchmark condo apartment price falling for 7 months in a row now, from 11.6% in August to 7.9% last month. (Don't get me wrong - 7.9% is nothing to sneeze at; I would happily take that rate of appreciation going forward. I'm just saying it's not the kind of crazy returns anymore that make people want to cash in their Bitcoins and cannabis stocks and buy investment condos.)
One weak sign is that Feb sales were one of the smallest of the decade (finishing 8th of the 10 years). And this is as a lot of new condo inventory has been built.
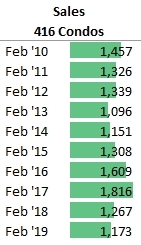
Actually, 20 of the last 22 months were lower than the prior-year (for the same month). While overall 416 volumes were down 6.3%, it was lower in condos (7.4%) than it was for freeholds (3.6%). As you see above, February sales rolled back about 5 years, being the lowest since 2014.
But it's hardly a catastrophe. Sales are low, but inventory is still at crazy-low levels, one-third lower than the average of the last 7 years:
So that's keeping months of inventory (MOI) low, which means prices are likely to keep rising (remember, I didn't say prices are falling - just that the rate they're rising has slowed).
3) That all said, condos are fine
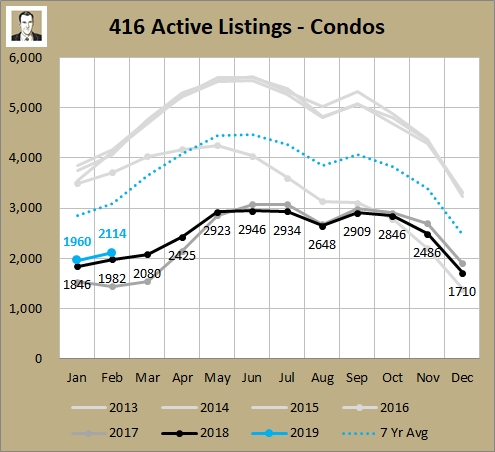
The biggest issue for condos since February 2016 is that inventory levels have been ridiculously low. You can see below how closely monthly active listings followed each other from 2012 to 2015, then the Feb 2016 numbers broke away and have stayed low since. (Note these next two charts include condo townhouses)
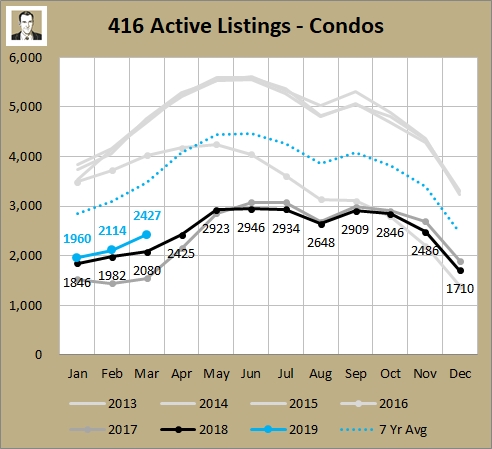
The March 2019 figure of 2,427 available units is 30% lower than the 7-year average (1,041 less units on the market), and a whopping 48% less than the 2012 to 2015 average.
So even though sales are down, as talked about in section 1 of this post, active listings are down too, keeping the market tight. That relationship between sales and active listings can be seen in Months of Inventory below.
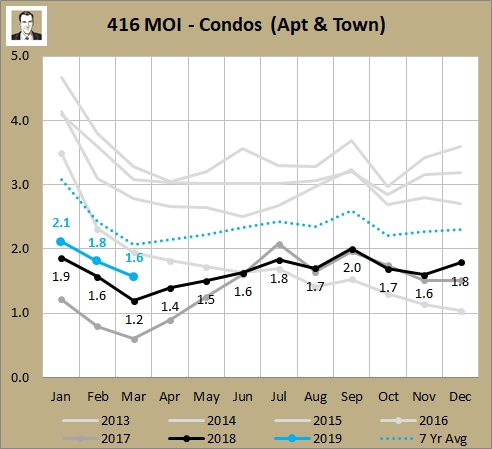
You can see the 1.6 in March is easing off from tight 2017 and 2018. While that's good, it's still the 3rd lowest March ever, so it's still favoring sellers. I'd still definitely call it a seller's market, whereas I'd classify the wild 0.6 MOI in March 2017 as an "extreme seller's market."
So though things are slowing down in the condo sector, it's still a fair distance away from being a buyer's market (or even a balanced market). Not until we see the active listings return to higher levels and buyers have more choice.
As always, you will find the full set of market charts (for this month and prior) on my SlideShare.
► To share this post or to add your comments, scroll down a bit below.
About Scott Ingram CPA, CA, MBA
Would you like to make better-informed real estate decisions? I believe knowledge is power. For that reason I invest a lot of time researching and analyzing data and trends in the Toronto real estate market. My Chartered Accountant (CPA, CA) side also compels me to perform a lot more due diligence on properties my clients are interested in purchasing. If you have better information, you should have less risk and be in a position to make better decisions for your hundreds of thousands of dollars.
Your home is the single largest investment you'll make - trust it with an accountant.
Post a comment