

Here's your Toronto real estate market report for May. On the heels of April GTA-wide sales numbers being up 16.8% over 2018, May is up 18.9%. But as always, we like to dig a little deeper.

Below is what I saw in the May stats. As always, these are just selected highlights. The full set of market charts is available on SlideShare.
1) The return of lowrise sales
Zooming in on that +18.9% increase in GTA sales over last May, it was up 13.1% in the 416 and 22.6% in the 905. The reason 905 if higher than 416 is that 60% of 416 sales are condos that market has flattened out (condo apartment sales were -0.2% for May). So looking at 416 freeholds, they increased from 1,320 sales in May 2018 to 1,696 this year, which is up 28.5%.
In the rolling 12 month look, you can see freehold sales have stabilized within +/- 250 transactions of 11,750 for the past 14 months, since April 2018.
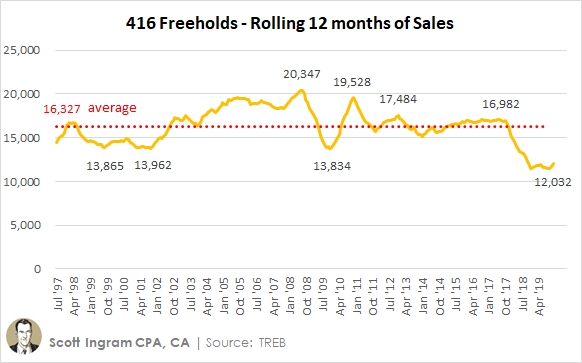
Don't get me wrong - we are still near 24-year lows (which was hit just 2 months ago at 11,469), so it's not a rosy picture. But this was the first month the rolling 12 months has hit 12,000 since March 2018. Other signs of a rebounding:
- Detached sales were 1,180 for May, which was the highest month since April 2017
- Total freehold sales were 1,696 for May, which was the best May since 2016
- Freehold MOI was 1.8 for May, the lowest of May since 2016
Last month when things started looking up, I commented: "One month's result doesn't fix a slump, but it could be a sign." Well, two months don't guarantee we're out of the woods yet (things don't always move in a linear fashion), but it's more encouraging.
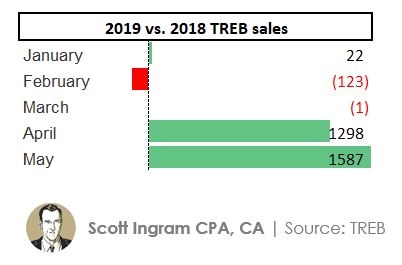
For the whole TREB reporting area (let's call that "GTA"), sales transactions had been floating right around 2018 levels in the first three months of the year until the big YoY increases in the last two months.
2) Condo price growth deceleration ending?
In March I talked about weakening in the condo market (which I've been mentioning since December results). In April I talked about a 3-month streak of YoY price change deceleration (from 11.5% down to 2.2%) had stopped (by increasing to 5.8%), but that it was something to monitor. This month it is sitting at 6.6%, so it may have stabilized.
It's interesting that condo apartment volumes (which are 90% of all 416 condo sales, with condo townhouses being the remaining 10%) fell 0.2% YoY as mentioned at the top, but prices are up 6.6%. This is happening because inventory is still really low, with condo active listings sitting 30% below 7-year averages (meaning about 1200 fewer places available for saie). So months of inventory (MOI) is still really tight at 1.5. That's 26 months in a row that condo MOI has been lower than freeholds, by far the record streak.
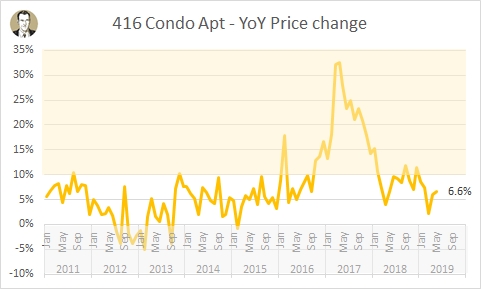
The 6.6% YoY price increase is close to inline with the 20-year CAGR for condos of 7.0%, and not all out of wack and due for a regression like the crazy recent peaks into the yellow zone above (greater than 10%).
3) TREB spin
Here is how the monthly GTA-wide sales figures have compared to 2018 so far this year on a month by month basis (absolute numbers in a chart above), and a snippet from the accompanying press release for each one:
January: +0.6%
“Even though we’re seeing positive government action on a number of key housing files, one area that needs to be revisited is the imposition of the OSFI-mandated two percentage point mortgage stress test. While we saw buyers return to the market in the second half of 2018, we have to have an honest discussion on whether or not today’s home buyers are being stress-tested against rates that are realistic."
February: -2.4%
“The OSFI mandated mortgage stress test has left some buyers on the sidelines who have struggled to qualify for the type of home they want to buy. The stress test should be reviewed and consideration should be given to bringing back 30-year amortizations for federally insured mortgages."
March: -0.0%
“The OSFI stress-test continues to impact homebuyers’ ability to qualify for a mortgage. TREB is still arguing that the stress test provisions and mortgage lending guidelines generally, including allowable amortization periods for insured mortgages, should be reviewed."
April: +16.8%
“While sales were up year-over-year in April, it is important to note that they remain well-below April levels for much of the past decade. Many potential home buyers arguably remain on the sidelines as they reassess their options in light of the OSFI-mandated two percentage point stress test on mortgages. Longer-term borrowing costs have trended lower this year and the outlook for short-term rates, for which the Bank of Canada holds the lever, is flat to down this year. Unfortunately, against this backdrop, we have seen no movement toward flexibility in the OSFI stress test,”
May: +18.9%
"While this result represented a substantial increase of 18.9 percent over the 15-year low in May 2018, it should be noted that the result was still below the average for the month of May sales for the previous 10 years."
"However, sales activity continues to be below the longer-term norm, as potential home buyers come to terms with the OSFI mortgage stress test."
It's pretty funny. So the first three months of the year, GTA volumes were pretty flat to last year (within 2.4% each month). And it's pointed out that the government really ought to relax the stress test as buyers are on the sidelines and struggling to qualify for buying a home. Now the last two months are up 17% and 19% and it looks like buyers are rushing onto the field from those sidelines like their team just won the championship.

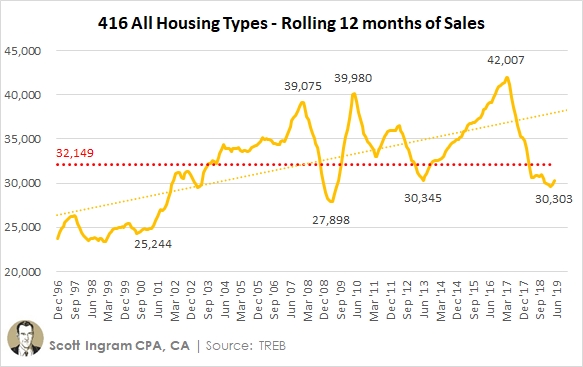
But now wait - don't get too excited. Yes, sales are up a lot from last year, but all of sudden we're reminded these sales are still below the 10-year average.
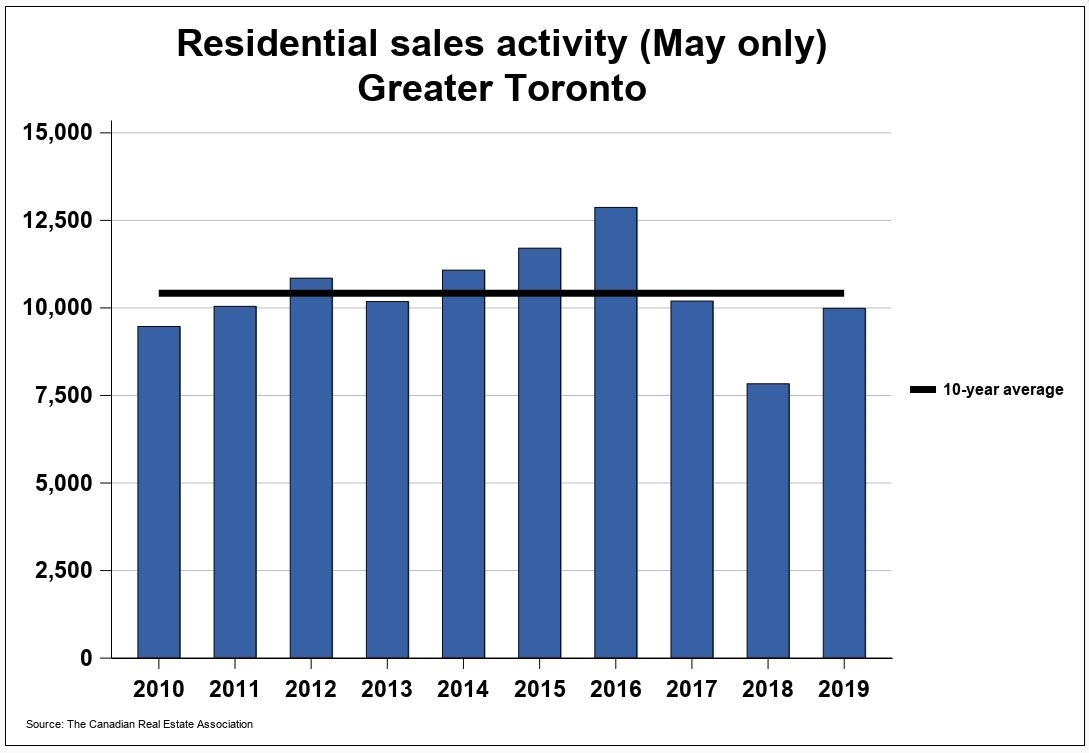
So you see above that's true, but now we're only off the 10-year average by about 3%. I'll tell you what - the first 3 months of the year were also below the 10-year average. Way below, as a matter of fact. Here's a rolling 12-month look at sales (just 416). The rolling 10-year average is 34,874 so we have been below that average for 17 months in a row now. Funny they weren't really broadcasting how poor the transactions were until now.
Volumes way up year-over-year, or volumes at 10-year averages doesn't suit TREB's narrative that the OSFI stress test is making people struggle to purchase so we really ought to ease it. Of course, easing or removing the stress test gets buyers to access to more money, which they can then use to bid up prices, which makes realtors more money since they work on commission (and probably gets more transactions through the system too).
The stress test is just one-factor affecting buying. Another is consumer confidence, and TREB's May results press release refers to spring polling by Ipsos that suggested: "the share of likely homebuyers in the Greater Toronto Area has edged upwards since the fall." And of population changes (report last week showed the City of Toronto gained 77K people in the last year and 125K in the GTA), and course economic conditions. But I think it's pretty fair to say that the population changes and economy haven't changed so drastically in the last 12 months to make way more people want to buy, so buyers must be pretty adjusted to the stress test by now. It will be interesting to watch and see how much longer TREB can continue with this talking point as it's going to be more and more of a reach.
As always, you will find the full set of market charts (for this month and prior) on my SlideShare.
► To share this post or to add your comments, scroll down a bit below.
About Scott Ingram CPA, CA, MBA
Would you like to make better-informed real estate decisions? I believe knowledge is power. For that reason I invest a lot of time researching and analyzing data and trends in the Toronto real estate market. My Chartered Accountant (CPA, CA) side also compels me to perform a lot more due diligence on properties my clients are interested in purchasing. If you have better information, you should have less risk and be in a position to make better decisions for your hundreds of thousands of dollars.
Your home is the single largest investment you'll make - trust it with an accountant.
Post a comment