

[Editor: This was originally posted in December 2016 on my old Century 21 blog. They changed platforms and did not migrate over anyone's blogs so those are all dead links now.  I've migrated some posts over to this website, but not many monthly chart ones. I made an exception here since it was my first.
  ]
]
How is the Toronto real estate market doing? Well, it's really two different markets: houses and condos. And they have different supply and demand factors and so behave differently. So instead of lumping $2 million houses in with $400K condos I've separated them, and instead of lumping properties from Burlington to Innisfil to Whitby together, I've pulled out just the 416 as it's like the middle of the cinnamon roll.
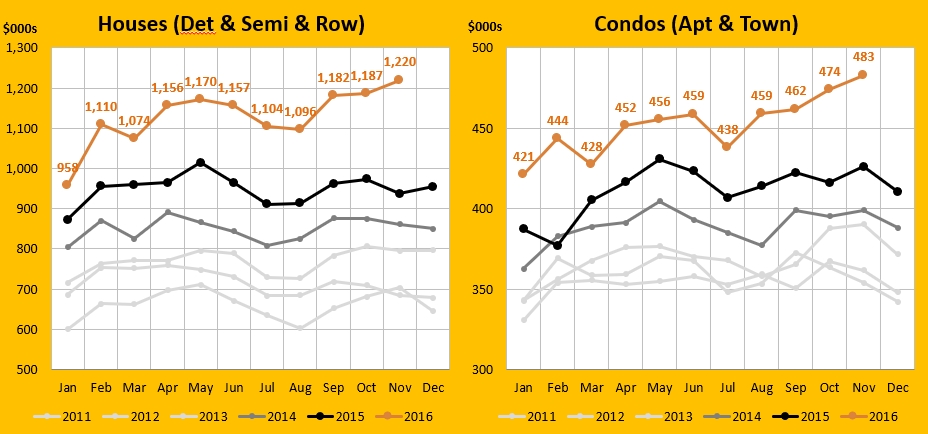
Average prices
This has been a pretty insane year for price growth. Houses are up $283K over last year (30.1%) and prices have increased an average of $26K a month. Condos are up $57K (13.4%) over last year which is the largest increase since 2009.
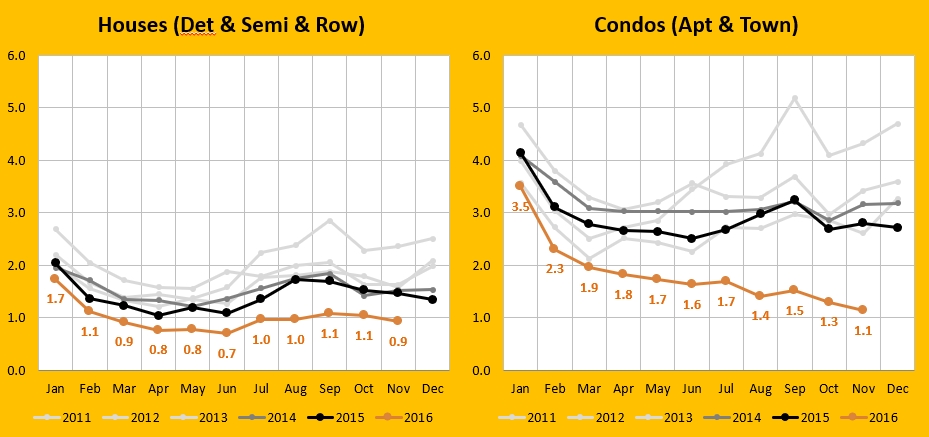
Months of inventory
This one chart pretty much tells you the reason for the skyrocketing prices. MOI tells you how long the current active listings would take to sell given last month's demand. A "balanced market" is often cited to be between 4 to 6 months (some sources say 5 to 7, i.e. 6 months +/- one month). Houses have dipped below 1 month of inventory, and even Condos, which have hovered around 3 months in the past few years are now down to almost 1 month of inventory. This is currently an extreme sellers market.
$1000 Ticker
This is how many hours it has taken this year (Jan 1 - Nov 30) for the price of a house and condo to go up by $1,000. It's the manifestation of the forces above.

These 3 charts were excerpted from my just-posted SlideShare presentation. Visit it to see just how historically low the supply has dropped for houses and condos alike, and to see how the average time on market for houses and condos have both dropped by over a week this year,. You'll also see price increases for each of the past 20 years and find out the 20 year returns for houses and condos.
About Scott Ingram CPA, CA, MBA
Would you like to make better-informed real estate decisions? I believe knowledge is power. For that reason I invest a lot of time researching and analyzing data and trends in the Toronto real estate market. My Chartered Accountant (CPA, CA) side also compels me to perform a lot more due diligence on properties my clients are interested in purchasing. If you have better information, you should have less risk and be in a position to make better decisions for your hundreds of thousands of dollars.
Your home is the single largest investment you'll make - trust it with an accountant.
Post a comment