Carrying on the narrative from last month, condos are still having a rough go of things, and freeholds are not.
You'll find the full set of market charts (only excerpts are highlighted below) here on my website. Let's get at October...
Freeholds are all caught up
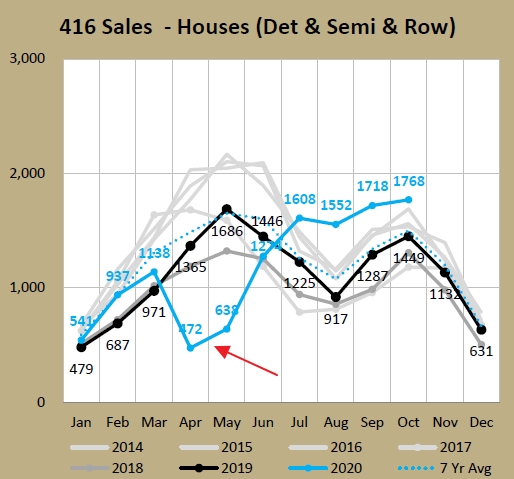
It's pretty crazy to look back at that sales hole from April (-65% YoY) and May (-62%). Heck, even June was -12%. The sales transaction deficit bottomed out at the end of June, with sales 1,634 behind 2019, 25% lower. And yet, with a strong last 4 months freehold volumes are now ahead of last year's YTD October volumes by 1%. I wouldn't have guessed in May that we'd have dug out of that spring hole by the end of the year, let alone by now.
Plus average freehold prices are up 9.5% YoY. Even checking the HPI, Single Family Detached is up 10.7% and Single Family Attached is up 9.4%. MOI for freeholds (1.3) is the second lowest ever for October.
Condos are sliding backwards
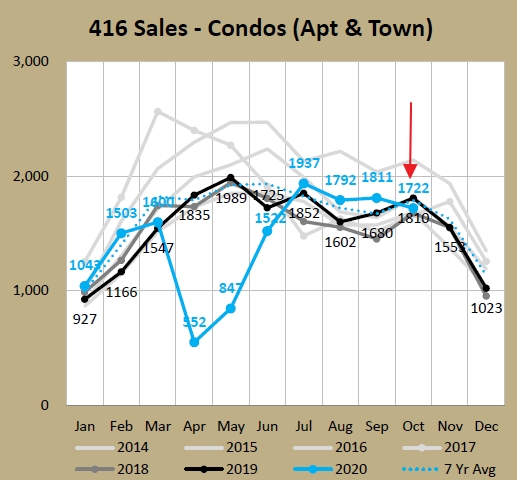
The condo sales deficit also bottomed-out in June also, falling 2,122 transactions behind 2019 (-23% YoY at that point). The deficit has shrunk by about 300 sales, but it's still sitting 11% behind 2019. But after a few months of pent-up demand getting satisfied, October condo volumes were actually 5% below last year (in contrast to freeholds which were 22% above). That's the first time since June when volumes were still digging themselves back from lockdowns.
And inventories rising at a pace eclipsing sales has led to a fairly rapid increase in months of inventory, which has weakened prices. Average prices in October were very close to last year, just 1.0% above. Other than the anomoly that was April, it's been a long long time since there wasn't YoY price growth (February 2015). I think the Home Price Index is probably a better representation, and after for Condo Apartments it reached a high this year of 12.9% YoY increase in March, it has shrunk 7 months in a row, to now sit at 4.9%. The $611K HPI price is $23K below the May high of $634K.
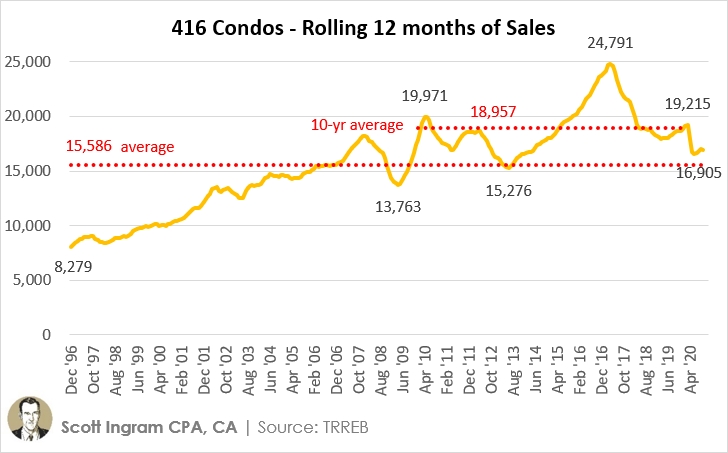
MOI for Condos (3.6) is tied for the highest this year, and the highest October since 2012 (4.1). It's interesting to note that the condo volumes are now closer to the 25-year averages than they are to the 10-year average. There are way more condos available for sale now, as well as a much larger population, so the current trading levels seem pretty low to me. But investors were driving those volumes up so it only makes sense that they'd slide back when things aren't looking too good for investors (or at least a lot riskier).
What will November bring?
For October, I said, "the inventory will have to stop rising before things even think about stabilizing. The growth in listings is slowing, but they're still piling up."
While it increasd over the month of October, the rate slowed a lot. The 416 condo active listings at the end of October grew by 268 over the end of September, but that's a lot slower than the 958 net added in the month of September. The condo inventory has finally started inching down for the last couple of weeks, which is totally normal for this time of year. A serious second wave (or are we at third?) could mess up these numbers, but at least we have some stability from the Bank of Canada who have indicated interest rates are not going anywhere for awhile.
Again, the full set of charts are available here. Stay tuned and stay well.
About Scott Ingram CPA, CA, MBA
Would you like to make better-informed real estate decisions? I believe knowledge is power. For that reason I invest a lot of time researching and analyzing data and trends in the Toronto real estate market. My Chartered Accountant (CPA, CA) side also compels me to perform a lot more due diligence on properties my clients are interested in purchasing. If you have better information, you should have less risk and be in a position to make better decisions for your hundreds of thousands of dollars.
Your home is the single largest investment you'll make - trust it with an accountant.


Post a comment