

I've been noticing more terminated listings recently, and they indicate a shift in the Toronto market for houses. Here's an actual example, with a bungalow in W02 Runnymede-Bloor West Village (the listing agent saw my blog post and kindly requested I take down the picture, so that's why it's all blacked out):

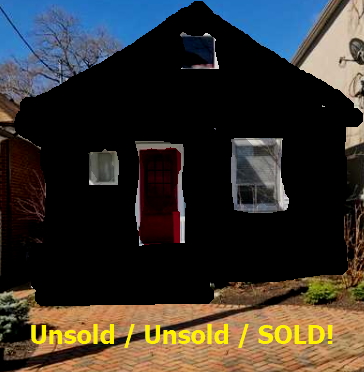
This house was originally listed on April 25 with a price of $899,000 with an offer night of May 1. It obviously didn't sell on offer night as the listing was terminated on May 2 after 7 days.
Listing #2 was put up the same day of the termination. The new list price? $1,029K with "Offers anytime." This one was also taken down after 7 days, on May 9.
Listing #3 was immediately put up in its place with a $40K reduction to $989,000.
A "terminated" listing is one that's basically killed off, never to be revived (the MLS number is retired). There's another status called "suspended" that means it's basically sleeping (the MLS number is kept active and you can revive this listing when you're ready). Agents like to do a termination as the new listing will have the status of "new" and it will show as 0 days on market and look more fresh, as opposed to a DOM of over a week which some fear might make it look stale or have people wondering "What's wrong with this house that it didn't sell in a week?" (Crazy times here.) So the third "new" listing ended up selling in 3 days for $975,000.
I've seen it work the other way too, where a condo I was watching for a client was up for a week at $424,900, didn't sell so they terminated the listing after 7 days. Then they put a new listing with a lowered price of $378,800 and it sold in 1 day for $430,000. Go figure.
All of these terminations followed by re-listings are a problem because they make TREB's "new listings" stats artificially inflated. And it also distorts a common statistic for market hotness, the Sales to New Listings Ratio.
Are there any numbers that show terminations are up?
Since I've been seeing and hearing this exact kind of activity (less offers or no offers on offer night), I decided to look into the numbers to see if they would confirm this activity. Here's what it showed:
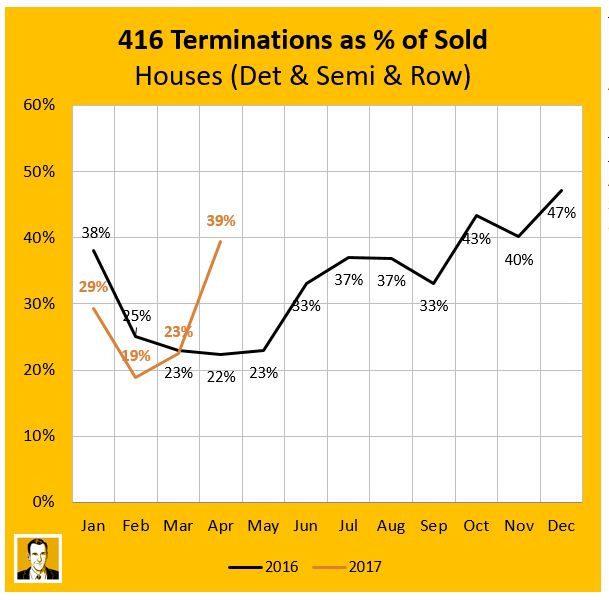
I've used terminated listings as a percentage of sales activity in the month as a proxy for "played the bidding war game but it didn't work," though there are other reasons a listing could be terminated. This isn't a perfect measure since the listing I showed you was actually listed in April but the termination and sale were actually in May so not even represented on this chart yet. But since I'm using the same measure consistently over time, I think it serves its purpose as an indicator. First of all, you wouldn't have agents trying the "offer night" strategy if it wasn't a seller's market. But I think if we look year over year or month to month, it can indicate some sort of heating or cooling.
Two things stick out to me on this chart:. The most glaring one to me is sharp up-tick from 23% in March to 39% in April. The second thing I notice is how 2017 started out lower than 2016 in this measure then caught up in March and zoomed past it in April. I read this as confirmation that the "offer night" strategy was a lot less successful in April, which marks a turning point in the market. Again, I still think it's very much a seller's market (as can be seen in my April market charts), but this seems to at least indicate a cooling, and possibly a turning point in the market.
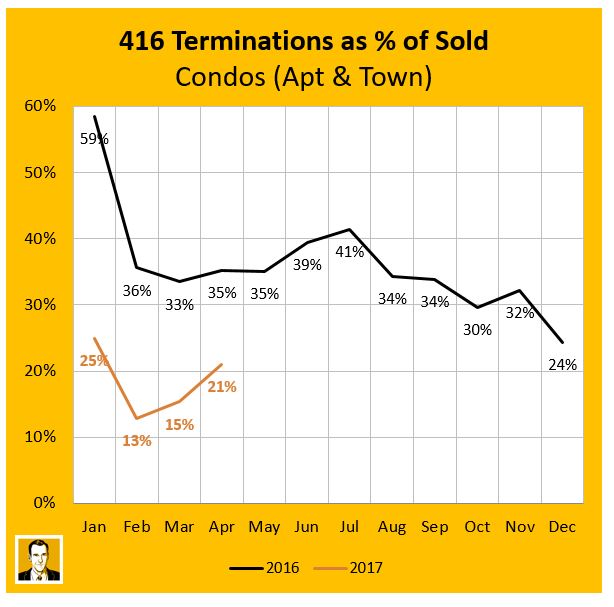
What's happening in condos?
Take a look at the condo chart. I find it very interesting that terminations as a percentage of solds decreased in the second half of 2016, as houses were increasing. Looking at the 2017 numbers so far, there was a 6% up-tick from March to April, but that's less extreme than the 16% up-tick in houses. You'll also notice that condos are 14% below where they were last April, as opposed to houses which are 17% above 2016's number. So it seems condos are still selling well. In fact the months of inventory for 416 condos was just 0.9 in April, which was below the 1.2 months for houses (indicating the supply wasn't keeping up with the demand as well for condos).
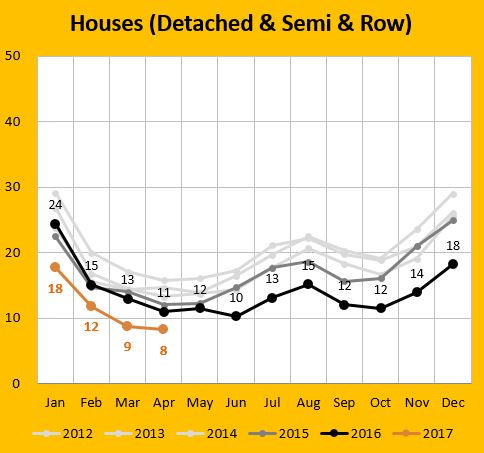
Be careful with days on market (DOM)
Below shows DOM for houses in the 416 over the last 6 years. You can see we are at historical lows, another indicator of a strong seller's market. But doesn't it seem a bit weird that DOM dropped from 9 in March to 8 in April after the termination stats we just looked at for houses? Part of that is due to the way TREB tracks its stats. It only looks at the listings with a sold status when calculating DOM, and ignores the terminated listings. So if we look to the example at the top of this post, That house was listed for 7 days, then 7 more days on listing #2, and then 3 more days on listing #3. So it was actually available in the system for 17 days from when it was first listed. But what DOM count in the TREB stats? Just the last listing, 3 DOM. So just keep that in mind average DOM stats are artificially low. They've always been that way, but now with the rash of terminations, it makes comparisons less meaningful across years or recent months.
Source for all statistics: Toronto Real Estate Board
About Scott Ingram CPA, CA, MBA
Would you like to make better-informed real estate decisions? I believe knowledge is power. For that reason I invest a lot of time researching and analyzing data and trends in the Toronto real estate market. My Chartered Accountant (CPA, CA) side also compels me to perform a lot more due diligence on properties my clients are interested in purchasing. If you have better information, you should have less risk and be in a position to make better decisions for your hundreds of thousands of dollars.
Your home is the single largest investment you'll make - trust it with an accountant.
Post a comment