

Here's your Toronto real estate market report for the month of March. The first two months of 2020 were really hot, even eliciting comparisons to 2017. Well March was a tale of two halves. The first two weeks of the month had GTA-wide sales up 49% over 2019, while the last half of the month was down 16%. The overall result was March looks positive compared to 2019, but the momentum of the second half, where emergency measures are in place and people are in isolation mode is carrying into April and you're going to see very low transactions in the month and a lot of other market cooling signs.

Below are my top observations of the month's statistics. The full set of market charts is always available right here on my website (NEW!).
1) Sales transactions - the tide has turned
So just last month in my blog on February stats, I had a section talking about how Freehold sales were back and one talking about pricing pressures in Condos. This month? Not so much.
The first 15 days of March (up to Sunday the 15th) were up A LOT over last year. Then on the Monday the 16th, the federal government announced a slew of new measures related to COVID-19, followed by the Ontario govnerment declaring an Emergency on Tuesday the 17th. So with people cutting down on leaving the house, buyers and would-be buyers didn't want to go out and see places, plus sellers and would-be sellers were less keen on having strangers walking through their homes (and possibly touching stuff). So check out the downturn in sales volumes after the 15th:
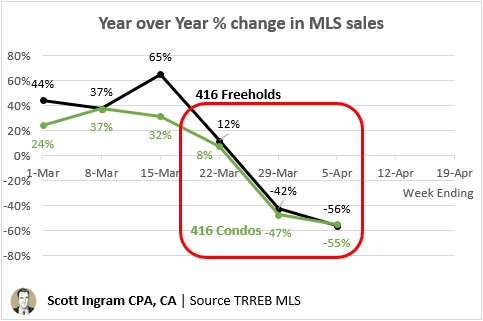
So the market has slowed right down the past couple of weeks, which will be very evident in the April stats, where we'll have a full month of slowdown. But even in a half month of slowdown you can see the change:
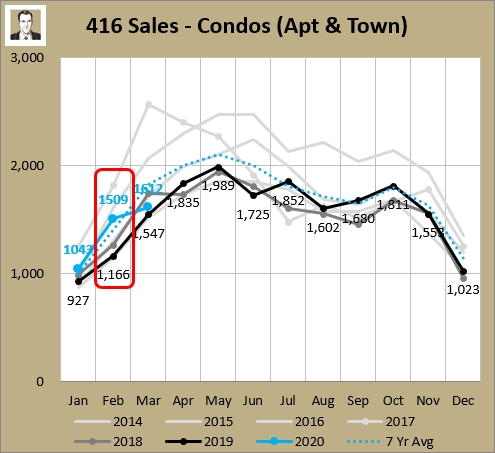
In February, 416 condo sales volumes were up 29% over February 2019. In March that slowed to just 4% over March 2019. In April it will be below, with early indications showing it might even be just half of the prior year's volumes.
2) What will happen with prices?
So demand (sales) will be down. Will prices fall too? Well that's going to partially depend on supply. And supply is currently at very low levels. Freehold active listings at the end of March were 8% lower than the average for the last 7 years. Condo active listings have been extremely low for a long time, and at the end of March were 42% below the 7 year averages.
The relationship between supply and demand is shown in months of inventory (MOI). The formula is active listings (snapshot at the end of the month) divided by the sales velocity for that month. At the end of March there were 1,773 active condo listings in the 416, and for the month of March there were 1,612 sales recorded. That works out to an MOI of 1.1, as shown below. It's saying at the current pace it would take just over a month to sell all the condos currently listed.
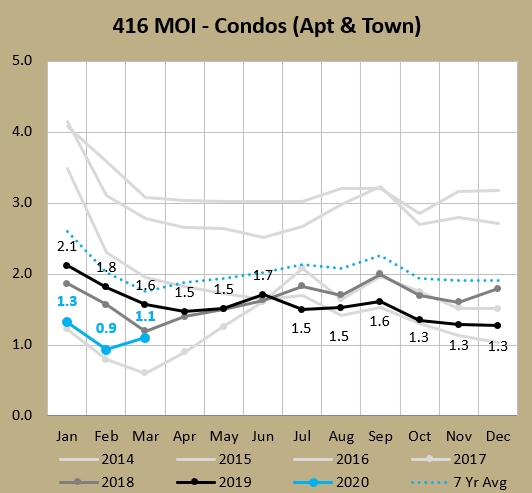
The lower this number is, the deeper into a seller's market we are. The higher the number (e.g. if it would take 8 months to sell all the inventory), the more towards a buyer's market we are. Generally people think of a "balanced market" (i.e. not favouring buyers or sellers) is between 4 and 6 MOI, though some people believe this balanced point is different in different markets (some believe Toronto's balanced mark is lower, like around 3 MOI). When we're deep into a seller's market, that's when you see high year-over-year (YoY) price climbs. Look how low the first three months of 2020 were. The YoY price increases for Jan/Feb/Mar for 416 condos were 13%, 18%, and 17%. That's high.
I've heard some people point to March prices ($902,680 average for all of TRREB) being down versus February ($910,290 average) as proof things are already declining. To those people, I say, "Whoa, let's look under the hood before relying on averages."
First of all, February transactions had 3.67% occur at the $2 million price point or higher. In March that figure shrunk to 3.05%. Does that sound small? Well at March's volumes it would've meant almost 50 more sales at the $2 million mark (294 by applying February's 3.67% rate to the 8,012 March transactions - instead of the 245 actual sales at or higher than $2 million). That's more than $100 million of revenue there. Just saying mix of sales transactions has a lot to do with this. If we look at the TRREB-wide home price index (HPI) composite number, which tracks benchmark homes like the CPI tracks a consistent basket of goods, prices increased from February ($846,100) to March ($865,200).
Those numbers I just gave were GTA-wide. You know I concentrate on 416 here, so ooking at 416 Freeholds (58% of dollar volume last year), they usually decline from February to March. In fact they've gone down month-over-month in 4 of the last 5 years, and 16 of the last 20. March average 416 Freehold prices were down 2.4% over February, while the average over the last 20 years is a decline of 2.1%. So that's really not proving much.
416 Condo average prices were down 2.1% in March vs. February but they were down last year too, and 3 of the last 5 years. The average over the last 20 years here is slightly positive at 1.2%, so this does underperform, but in and of itself I wouldn't call it concerning.
For the next few months, unless listings rise rapidly (and they haven't so far - I watch this closely on a weekly basis) the MOI will stay relatively low and the prices should remain fairly stable. If this recession goes deep and long then prices will probably decline down the road as demand will stay low, and some overleveraged people will be looking to sell their homes - or at least their "investment properties."
3) What's going to happen in the long term?
Damned if I know. Information changes daily with this COVID-19 thing. Levels of government keep enacting new measures, and introducing new relief programs. I'd only be guessing. But one thing I'll say is that real estate is encountering a lot more potential headwinds (e.g. possible major recession) and hurdles (e.g. limited showings) than tailwinds (e.g. low interest rates) at the moment. With most asset classes around the world taking a large value hit, it would seem unusual if Toronto real estate values remained as high as they are. But this market has defied gravity before.
As always, you will find the full set of market charts (for this month, and for archived prior months) on this page on my website (NEW!).
About Scott Ingram CPA, CA, MBA
Would you like to make better-informed real estate decisions? I believe knowledge is power. For that reason I invest a lot of time researching and analyzing data and trends in the Toronto real estate market. My Chartered Accountant (CPA, CA) side also compels me to perform a lot more due diligence on properties my clients are interested in purchasing. If you have better information, you should have less risk and be in a position to make better decisions for your hundreds of thousands of dollars.
Your home is the single largest investment you'll make - trust it with an accountant.
Post a comment