

Here's your Toronto real estate market report for the month of February. The year has jumped off to a strong start, exhibiting signs of an extreme seller's market similar to early 2017. In fact, I just wrote a blog entitled "Just how closely does early 2020 resemble early 2017 in Toronto real estate?" because that's a popular headline now. My conclusion - and the same is my overall message for this month, is that there were a lot of statistics that were the "highest since X month in 2017" but they aren't quite at that level of craziness yet.

Below are my top observations of the month's statistics. The full set of market charts is always available right here on my website (NEW!).
1) Freeholds - the sales are back
So in my blog on January stats, I had a section called "Lowrise heating up as well," so this is not a new thing to say, but the Freehold market (meaning non-condominium ownership, which we see in detached, semis, and rowhouses, so I also just call "Houses" sometimes) has some intensity. Here are a few ways this shows itself in the stats.
First, active listings are essentially tied with 2016 as the second lowest number in the last 25 years, which was the same story as January. Whatever inventory is being put on the market is being gobbled right up. The levels are 19% below the 10-year average.
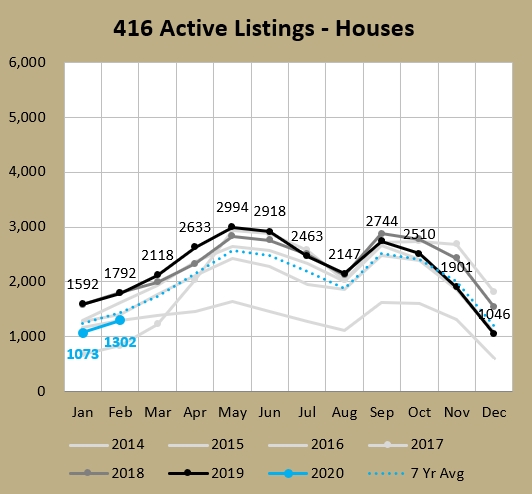
So inventory (supply) is 19% below the 10-year average. What about demand (sales)? Well that's only 5% below the 10-year average. Freehold says jumped up 38% year-over-year (YoY), which was the highest YoY percentage increase for any month since March 2010. To be fair, last February's 416 freehold sales number were a 25-year low, so it's easier to have a big gain off of a small base (in absolute sales, the 262 unit increase was the fourth largest gain in the last 25 years). To me the more significant thing is that sales went from being 7% below the 7-year average in January to 2% above for February. They're bouncing back.
So you've got less supply and more sales, so competition is getting tougher and that's putting upward pressure on prices. The average 416 Semi-detached house sold for $1,208K, the first time ever above the $1.2M barrier. Rowhouses sold for an average of $1,063K, which was the second highest month ever.
Here's another way you can see some pricing pressure:
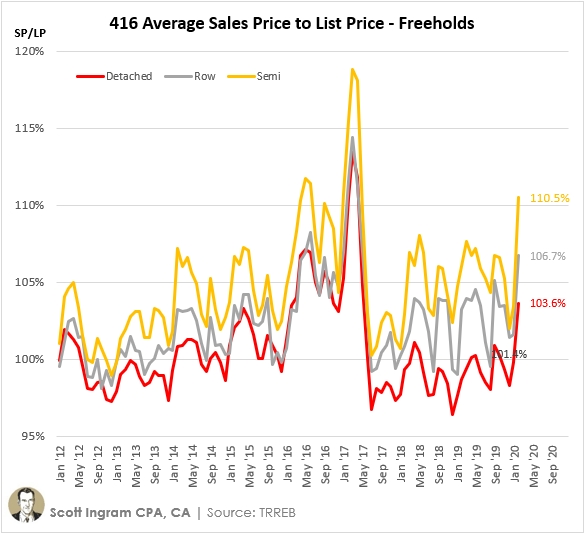
Semi-detached houses haven't been as high as 110.5% since April 2017. This is saying that a semi with a list price of $1,000,000 would sell for $1,110,500. It's obviously that b.s. thing that happens in Toronto real estate where houses are purposely under-priced then offers are held to generate a bidding war, resulting in a final sold price "over asking" (and from the seller's perspective, hopefully a bit higher than they were aiming to get). It's a similar story for Rowhouses and Detached, which both hit their highest marks since May 2017.
2) Condos - talk about pricing pressure
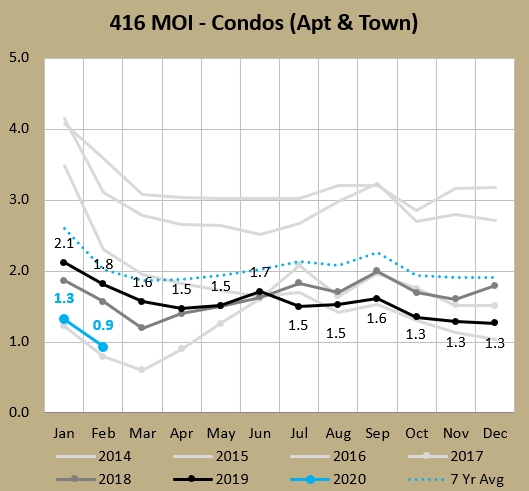
Okay, this is a very similar title to a section I did on condos in last month's January stats blog post. But it's still noteworthy an I want to continue on with talking about upward pricing pressure like we just were in freeholds. This months of inventory (MOI) chart is noteworthy because the condo market has tightened so much that MOI has dropped below 1.0. That's an extreme seller's market right there. This is only the fourth month ever with condo MOI < 1.0, and you can see the other three were right at the 2017 market peak.
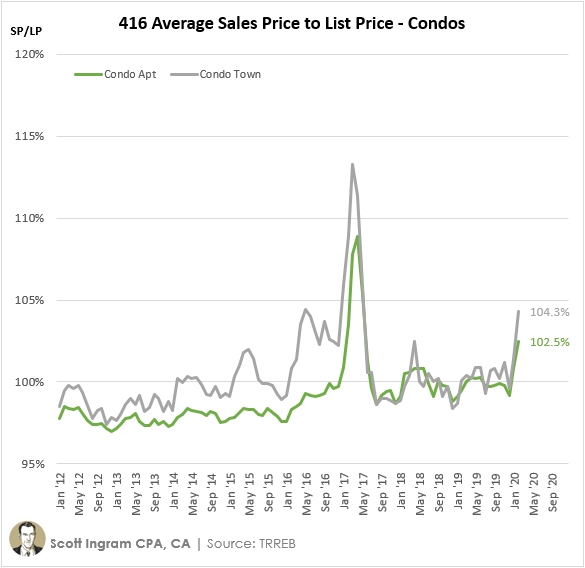
Here's the same sales price to list price chart as I showed above for freeholds, and it tells the same story. Both condo apartments and condo townhouses reached their highest points since May 2017. In the 290 months of data I have, condo townhouses have only had 6 months higher than the 104.3% reached in February, and condo apartments have only had 5 months higher than the 102.5% shown below.
Condo apartments reached the $700K average price barrier for the first time last month, soaring past it to reach $723K. The first time it reached $600K was just 22 months ago in April 2018, and it was only 36 months ago when it topped $500K for the first time.
3) Price pressure - not quite at stupid levels
The average freehold price has been accelerating, reaching 15.3% YoY in February, up from 13.6% in January, and the third month in a row over 10%. But thankfully that's nowhere near the numbers in early 2017. Price increases for Detached (which make up about 70% of 416 freehold sales) for the first three months of 2017 were 26.8%, 29.8%, and 32.8%. I think people's memories are long enough to remember that. The detached market has taken awhile to come back, and the average prices in the 416 still haven't got back to that couple of month peak (even more so in the 905).
However, Condos I'm a little more worried about. In January there were up 13.4% YoY, before rising further in February to up 18.1%. Compare that to Condo Apartments (90% of the condos sales number) for the first three months of 2017: 13.1%, 18.2%, 32.0%. Condos didn't dip much after peak. Actually the HPI for condo apartments only dropped from $485K to $478K and was fully recovered in 4 months. The HPI for townhouses (condo and freehold) took 11 months to recover, single family attached (semis and rows) took 29 months, and detached is 33 months and counting (but back to $44K under). So I'm saying condos didn't really correct much. And when I look at this, I worry:
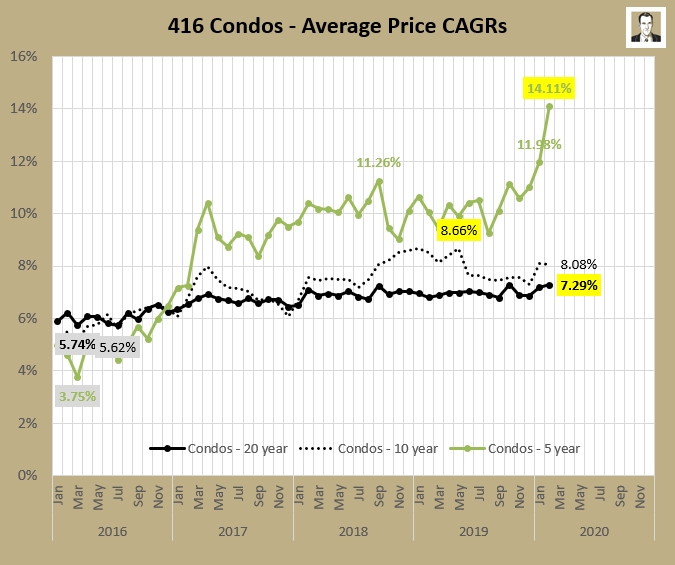
You look at how far above the long-term 20-year CAGR the 5-year one is, and there appears to be some serious "regression to the mean" due. But I said the same thing last month and the 5-year number jumped an outrageous 2.13% in one month. On a 5-year number! I can see condo prices in double-digits on a one-year view happening once in a while when things are hot. And okay, sure on a 5-year view when your arbitrary start and end dates play into things more than a long-term view. But for a 5-year number to remain above 10% for the better part of 3 years - and to hit over 14%, that's a little nutty to me. I checked 416 freeholds and they did spend over 2 years in the 10 percent+ zone, but that included the rise and fall portions. Freeholds had a 5-year CAGR peak of 13.7% to 13.9% in Feb, Mar, and Apr 2017 before sliding back down after some air was let out of the detached market's sails.
What's it going to take for condos to calm down? Maybe the big wave of GTA condo completions due this year, and the upcoming Airbnb regulations in Toronto that will ban people from running ghost hotels will help. But on the other hand the just-announced 0.50% rate cut by the Bank of Canada is just going to let people throw more money at housing, and so is OSFI's recent proposed tweak to the mortgage stress test. So it might get worse before it gets better.
As always, you will find the full set of market charts (for this month, and for archived prior months) on this page on my website (NEW!).
About Scott Ingram CPA, CA, MBA
Would you like to make better-informed real estate decisions? I believe knowledge is power. For that reason I invest a lot of time researching and analyzing data and trends in the Toronto real estate market. My Chartered Accountant (CPA, CA) side also compels me to perform a lot more due diligence on properties my clients are interested in purchasing. If you have better information, you should have less risk and be in a position to make better decisions for your hundreds of thousands of dollars.
Your home is the single largest investment you'll make - trust it with an accountant.
Post a comment