Three and a half years ago, in the midst of the spring 2017 correction, I wrote a blog post called Terminated listings: behind the scenes story indicates house slowdown which was the third most popular blog post all-time on my old Century 21 website. It told the story of how terminations (and subsequent re-listings) were messing with new listings stats, and also showing weaknesses behind the scenes.
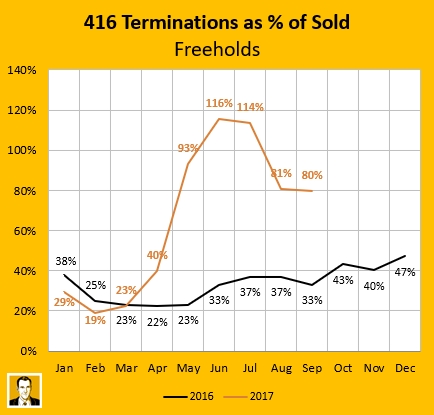
I posted the blog in May 2017 when the April Freehold number was the 40%, but I'd noticed it rising on a weekly basis. You can see things got way worse, with this stat peaking in June and July of 2017.
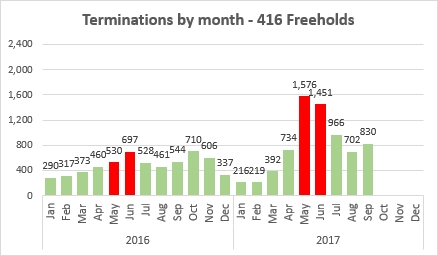
And you can see below there was a massive spike in the absolute number of terminations in May and June compared to the prior year (though to be fair, the prior year was extremely hot). Things changed fast.
So what's the theory behind tracking cancellations?
When the market is hot, properties sell quickly (often in bidding wars). In Toronto we have become accustomed to houses selling quickly, so much so that if a place doesn't sell in a couple of weeks or (gasp) a month then agents and sellers are worried potential buyers will think it's stale or that "something must be wrong with it." So to keep it looking "fresh" an agent will cancel the listing and bring it out with a new MLS number. They may also use this tactic to do a price change, thinking that if someone sees that the price has been dropped they'll sense weakness (I guess). But if things are going well and your listing sells then you have no reason to cancel because it's already sold.
So if a lot of cancellations are happening, that's a sign things aren't going so well. Often this happens when the market shifts because agents are listing like it's hot, then finding out it's not and have to adjust. There are other stats that are interelated and also give you an idea of market heating and cooling. I really like months of inventory, which is active listings divided by sales. It shares the same sales component as cancellations as a percentage of sales. While active listings will rise if new listings come on, it won't change if something is re-listed. And you could look at some measure with new listings - but the problem is you don't know if they're legitimately new listings or "new" that are actually re-listings (which can severely overstate the new listings stat). To me, by looking at cancellations, you're getting an idea of the churn underneath those new listings and active listings numbers, and if there's a lot of churn it's showing things aren't happening as agents want and they're getting antsy. Agents aren't antsy when every property is selling in a week with 10-offer bidding wars. So to me checking the change in this stat can show quick changes in market sentiment.
I have been noticing a lot more re-listings lately so I decided to have a look at the numbers to see if they matched what I'm seeing anecdotally.
Before I do that, let me talk about the 3 ways listings can be ended:
1. Terminated - A terminated listing ends that MLS number and listing. It's like the STOP button. This is the most popular way listings are cancelled. Between Dec 2018 and now, the rolling 12 month share for terminations has been between 70% and 76% of all ended-by-not-selling freehold listings (and averaged 73% from Jan 2017 to now). The agent's office's broker of record has to do the termination on the MLS, or authorize an office admin to do it. They usually come right back on the market with a new MLS number.
2. Suspended - A suspended listing is possible to revive. It's like hitting the PAUSE button. Say a seller was going away for the weekend way up north and was going to be off the grid so couldn't take calls or email if an offer came in. The listing could be paused for those days and resume when they're back. This has averaged 12% of cancellations from Jan 2017 to now. This doesn't require the broker of record's involvement, so I think many agents that use this method do it because it's a little quicker and easier. Rarely are they unpaused - they usually come back as a new listing with a new MLS number.
3. Expired - This are ones that just age out. So say a listing agreement contract is for 120 days. And then 120 comes and the listing expires. That's this one. The minimum you can enter into the system is 60 days. This is 15% of all cancellations from Jan 2017 until now.
For the purposes of this analysis, I'm going to key in on what I'll call Cancellations, which is the sum of the two "active" ways to end a listing, i.e. Terminated + Supsended. Since Expired listings just rode things out for at least 60 days as pre-determined, I'm leaving them out of the analysis because I'm looking for agents making course-corrections. (If I do add up Terminated + Suspended + Expired, I'll call those Ended listings.)
For my May 2017 blog post I was only using Terminations (as in the charts above). They outnumbered Suspended by greater than a 6 to 1 ratio, so that's why I focused in on them.
So what's happening with cancellations now?
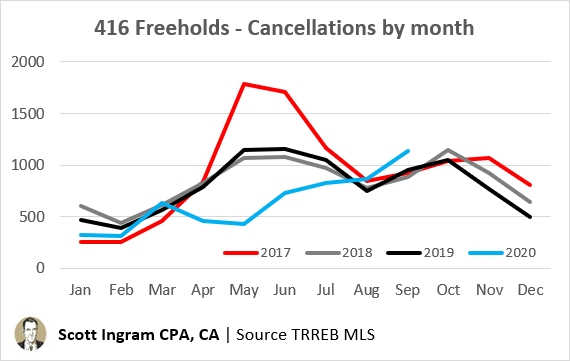
Well that depends what segment of the market you're looking at. You'll note from the charts at the top that my 2017 look concentrated on Freeholds, because that's the segment of the market that was rapidly changing (particularly detached houses which are about 70% of all 416 freehold sales). This time around I'm looking at all active cancellations (terminated + suspended). Note that 2017 (red line) still looks wild in terms of total cancellations, especially May (1791) and June (1713).
And note that 2020 (blue line) started low compared to recent years. Then stayed low in April and May because of the coronavirus (because there were not many listings around to cancel). They've since risen as sellers started brigning their homes onto the market. But in September they are a bit above recent years. It's something to monitor, though October month to date is about on pace for 2019 levels.
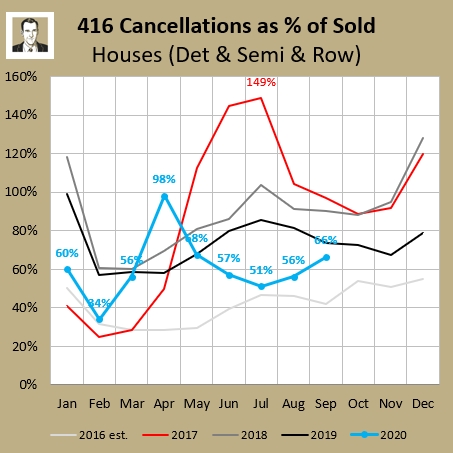
Now I'll switch back to as a percentage of sold. Note the 2017 numbers are higher than orginal orange chart above the because I'm also adding on suspended (and I'm using a slightly different source for the sold numbers - but as long as all of the lines on the same chart are on the same basis, than the comparisons will tell the proper story). So... this tells about the same story for 2017 (red), though the peak here is June and July instead of May and June.
But 2020 (blue) tells a different story than you get out of just looking at absolute canceallation numbers. Here you can see a big change in direction in March and a spike in April, as the absolute cancellations stayed about the same (as shown previously) but the sales fell right off. Then the market for freeholds tightened, and lately you see here signs of it easing off again (and continuing into October as the month to date number is 72%).
Condos are where the action is now
Well back in 2017 the big shift was the market was in detached houses. Looking at the Home Price Index (HPI), it peaked at $1229K and fell to $1100K by August - over 10% down in 3 months. (Over the next 5 months it turned into more of a slow leak, eventually getting as low as $1081K before renewing its climb.) On the other hand the condo apartment HPI peaked at $485K and only dropped by 1%, to $478K. So I wasn't watching this market as closely then. I'm sure watching condos now!
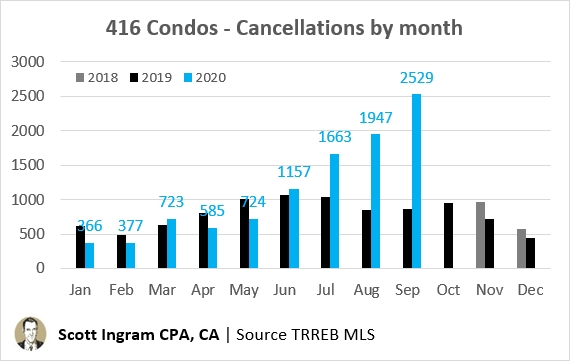
Here's how the absolute numbers of cancellations have been trending in condo land (which includes condo townhouses as well, but condo apartments are about 85% of total condo sales):
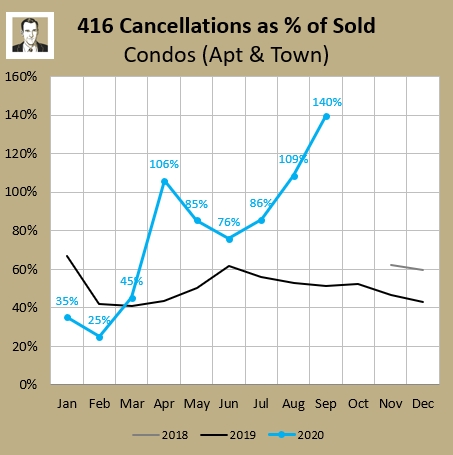
So that's quite a spiking we're seeing. Let's now look to the cancellations as a percentage of what's actually selling.
There you go again with the rise noticable in March, the big spike in April, then easing off as sales volumes started to rise, but not it's heading way up (October to date is 163%). You may wonder why I am not showing 5 years of lines here like I did for Freeholds. Well that has to do with how the MLS system works. I can pull these numbers for the last 24 months, but if I try to go into the "archived" data it's not really possible. With Freeholds I'd been watching the numbers since 2016 and had looked in again after, so I had the termination and suspended numbers already. With Condos I didn't so you're only geting a 24 month view. But from what I saw in 16 months of data 2016 and 2017 I'm very confident these are recent-year highs.
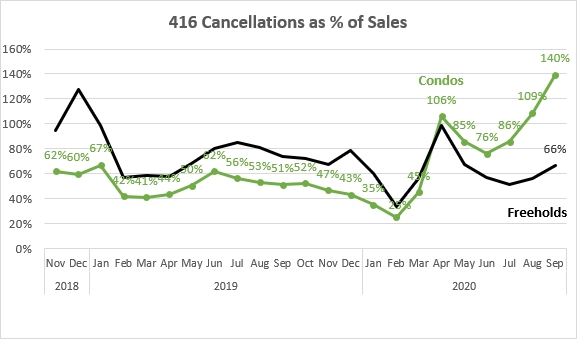
Let's put the numbers side by side for the last 24 months (below) and I think you'll see how this is a pretty good proxy for checking market hotness. Through 2018 and up until COVID-19 came on the scene in a big way, condos were the stronger of the two markets. That was also evidenced in the months of inventory (MOI) statistic, which had condos lower than freeholds for 36 months in a row up until March of this year. Historically that was very unsual, as in the prior 254 months that had only occurred 19 times in total. So condos were hot. They were so hot coming into 2020 that this cancellation % statistic didn't even do a mini spike up in the two most dead months of the year - December and January.
But after the first couple of months of people coming out of their April hardcore isolation and catching up on ye olde "pent-up demand", you can really see how the condo market has quickly shifted. And how the shift has caught agents off-guard. Many tossed listings up with artificially low prices hoping for bidding wars, only to see those multiple offers fail to materialize, at which point the agent and seller terminate and bring on a "new listing" at their actual desired price. Or I've seen people go like $650K, then not see traction, come out again at $599K holding offers, then see it come back again at $640K. Anyway, point is, when things aren't selling quickly agents will re-list to keep things looking fresh, and experiment at different price points.
To be open and transparent, I'm not above this. I have done this once. It was on a freehold listing earlier this year. On offer night we only got one offer, and it was not up to what we were expecting for the property, so we terminated the listing and put it back up at a higher amount with "offers anytime". The home was a bit quirky so it took a little more time to find the right buyer. (And it did sell for more than we were offered on offer night.) But you'll see agents do a $10K price change after one week and make that a new listing. Or it gets a few weeks old and they just put it up again at the same price, even.
But I personally wish re-listing was not permitted. But allowing artificially low days on market (DOM) keeps prices higher, so TRREB is all for it. I'm not just pulling this out of the air - there was an MIT paper published that studied what happened when the listing board Masschusetts changed policy around this exact thing (not letting people re-set their DOM), and it showed prices were dropped when true DOM was shown. Basically, "some buyers were unaware of sellers' manipulation of days on market and were thus unable to recognize home listings that were authentically fresh." If I could pick a number I'd say you have to leave a listing up for at least 60 days (which is the minimum contract length anyway), before you could terminate and re-list. Agents could sill try for a bidding war (one thing at a time here!), but if if failed then the only tool in the toolbox would be to do a price change on the listing (e.g. from $599K to $640K) and the DOM ticker would keep ticking instead of re-setting, and everyone would see the status as "PC" and not "New." It's more transparent. (Any good agent will look up the listing history for a property their client is interested in, and people that use savvier websites like HouseSigma can see this information for themselves.
Beware: the effect on other statistics
When this start of copious re-listing starts happening it has a knock-on effect on several statistics. For example:
Days on Market - The more re-listing is happening, the more out of whack true DOM is going to be. Because TRREB only counts the final listing in its official DOM stat. So if a property had 3 listings, of 7 days, 21 days, and 3 days, the DOM for the books is just 3, not the full 31 days it spent on the market. Now TRREB did implement a new stat in March 2019 called PDOM. The P stands for Property and would be the 31 in my example. They contrast that with their standard DOM, which they sometimes call LDOM, with the L standing for listing, and that would be the 3 days in my example. But the problem is this is only done on aggregate stats. So I can't see PDOM for condos, for example.
New Listings - As I mentioned in my terminations blog post from 3 years ago, new listings are going to be artificially inflated. The property in my DOM example would be a "new" listing 3 times. And those 3 could even be in the same calendar month. That's why I don't pay much attention to the new listings stat - because it has a lot of garbage in it, and the amount of garbage isn't even constant as you can see by my terminations number. I've just shown you there were over 2,500 condo cancellations in September, and over 1,100 freehold cancellations. A big majority of those would've come back on again as new listings. The official "new listings" stat for just the 416 was around 8,700 for the month - but it might be overstated by 3,000. That seems significant to me. I'm not sure why TRREB doesn't clean this statistic up - though I've heard them complain that comparisons to prior periods would be off. But fix it once and move on, instead of sticking with your bad stat.
SNLR - Sales to New Listings Ratio is a stat that purports to show if we're in a buyer's market or seller's market. If the sales are high compared to new listings (>60%) then the market is said to be a seller's market, and if it's low (<40%) then they call it a buyer's market. But if you've got 3,000 new listings that aren't really new - and that proportion shifts a lot - then this stat is not working as it should.
So just be more wary of these particular stats when the market is shifting - especially when it's softening, and happening quickly.
About Scott Ingram CPA, CA, MBA
Would you like to make better-informed real estate decisions? I believe knowledge is power. For that reason I invest a lot of time researching and analyzing data and trends in the Toronto real estate market. My Chartered Accountant (CPA, CA) side also compels me to perform a lot more due diligence on properties my clients are interested in purchasing. If you have better information, you should have less risk and be in a position to make better decisions for your hundreds of thousands of dollars.
Your home is the single largest investment you'll make - trust it with an accountant.




Post a comment