

Consumers are now armed with more data than ever on housing. TRREB makes all of its monthly statistics available to the public via its website (and has for a long time). You've got several websites to choose from that give you sold data. And you've got a handful that use some kind of algorithms (I'm assuming) to give you price estimates for homes that are currently on the market - which is important these days since 65% of freeholds (detached, semi-detached, and rowhouses) this year have been under-priced and "Sold Over Asking!"
You've got articles claiming iBuying is the number one trend, and companies like Zillow and Opendoor use their data to instantly (the "i" in iBuying) purchase homes (with Zillow buying 9,680 of them in Q3 this year).
But how good are these online estimators? Especially with Zillow announcing they're getting out of the iBuying space because it "can't sufficiently trust its pricing model" I think it's a good time to take a closer look, specifically at websites that have price estimates for Toronto properties on them. Luckily I've been doing my own tracking of performance of these price estimators for four years.
What's a good estimate?
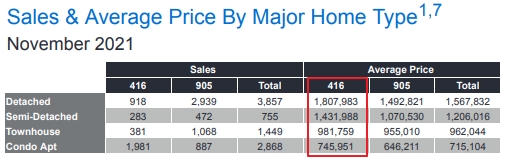
The average price of a detached home in the city of Toronto (416) for the month of November 2021 was $1,807,983. When you pull in other house forms as well as condominiums (apartments and townhouses), the weighted average across all housing types for November was just shy of $1.1 million.
So I don't think anyone should expect an estimate (whether a website's or their own realtor's) to be within 100 bucks. Let's start by taking a look at Zillow in the United States. It's the most popular real estate website in that country by a large margin:
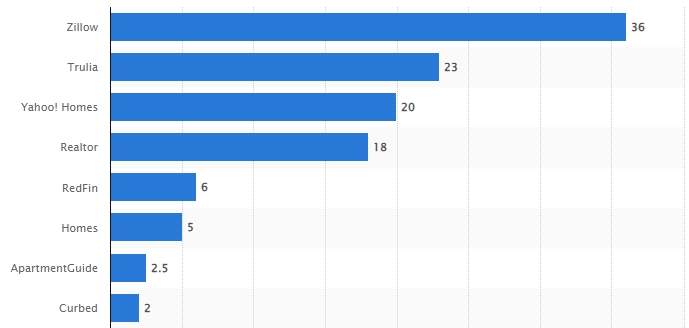
Most popular real estate websites in the United States as of October 2021, based on unique monthly visits, per Statista
It got there on the back of its wildly popular "Zestimate." I'll let the company explain:
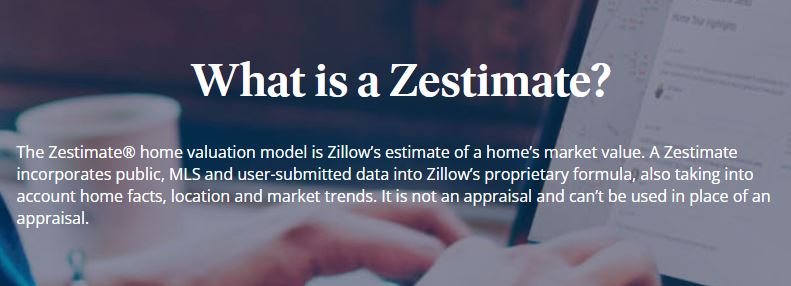
So basically you can go onto their site, look at a house, and (in many cities) look at Zillow's estimate of the value for the house. Consumers loved that, because it seemed to indicate if the house was overpriced or a deal or in-between. And they could see sold information for themselves. For some context, the average price of a home in the US in Q3 2021 was $USD 453,300. (At time of writing, about $CAD 576,10, and yes, I know what kind of condo downtown you could get for that.)
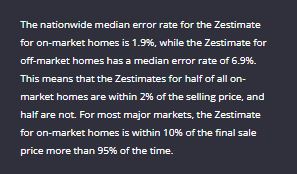
Since Zillow rose to prominence in large part based on its estimates, let's look at how good it is at them, since Zestimates are basically seen as the gold standard. It may surprise you, but back in 2006 Zillow's error rate was 14%. They kept making refinements to their algorithms and by 2017 that was down to 5%. But that wasn't enough so it announced a contest with a $1 million first prize to improve the model. A team of data scientists, including one Canadian, were declared the winners. They got the error rate down from 4.5% down to 4%.
It's important to know what Zilliow's 4% "error rate" means. It's the error margin at the median. In other words if the error rate is 4% then half of Zesimates will be within 4% of the eventual selling price. Which of course still means that half are going to not be within 4%.
But that prize was awarded nearly 3 years ago. Apparently in the meantime the company has got its overall error rate down to 2%.

How do our Canadian online home price estimators stack up against each other?
Let's switch to the local companies I've been tracking: HouseSigma, Zolo, and Zoocasa. First let's look at for tendencies to come in high or low:
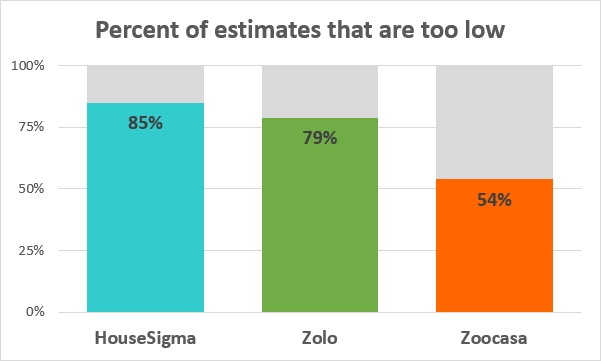
As you can see, all of them come up as too low in their estimates more often than not. And in the case of HouseSigma and Zolo, WAY more often than not (about 5 and a half times as often, and 4 times as often, respectively). From this you'd guess that Zoocasa looks best. I'd think that the best-constructed estimator be about half the time too high and half the time too low, but always right around zero error.
Before I go into further detail, here is my process. If a house came up that I was interested in tracking, I would record the address, the neighbourhood, the list price, and the estimate from each of the three websites. When the property sold, I'd record the sold price, and calculate how far the estimate was off in dollar and percentage terms. There were some cases where one of the websites didn't have an estimate, for whatever reason. Most houses sold, but some didn't. My analysis only tracks the ones that sold so that I could have something concrete to evaluate the estimate by. This year, starting in January and going until the end of November, I tracked estimates on 95 sold properties. HouseSigma had estimates on 93 of them, Zolo on all 95, and Zoocasa on 89.
Take this fake Zolo example:
List price: $1,000,000
Zolo estimate: $1,100,000
Sold price: $1,210,000
My tracking didn't care about how much it was "sold over asking," I only cared about how accurate the Zolo estimate was compared to the final sold price. In this example, the estimate was off by $110K, and when compared to the $1,100K estimate it's [Zolo estimate + 10%]. That 10% is the number I'm reporting.
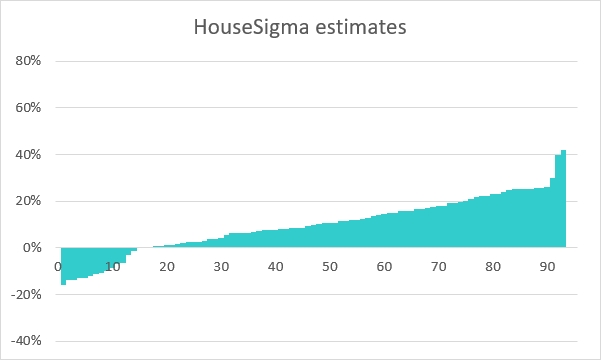
Let's look at the results, by website. First, HouseSigma ("HS") which we saw above frequently guesses too low. The perfect estimate here would be 0, and so on the bar chart below you're striving to have a bunch of short bars (close to that 0 line). Fourteen sold prices ended up lower than the HS estimate (including three I bought with my clients), 2 were bang on (0.0% and 0.1%), and the other 78 ended up higher than (or much higher than) the HS estimate. The upshot of this chart is that the average sold price ended up at HS + 9.1%. I calculated it using the sum of the dollars off divided by the sum of the total sold prices. If I just took an average of each estimate's individual percentage-off, it was HS + 10%.
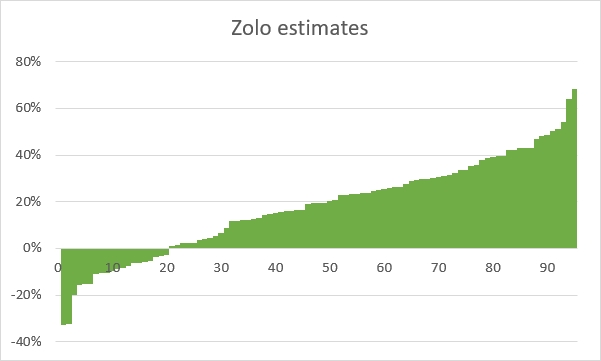
Let's shift over to Zolo. You can see below that the height of the bars has increased here, and there are a couple more of them (95 vs. 93 for HS). Whereas HS had only 1 time where the sold price ended up 40% or more than its estimate (the right side of the chart), that happened to Zolo 13 times. This ended up as Zolo + 13.5%. Again, that's the dollar calculation and the average percentage calculation comes in higher, at Zolo + 15.6%.
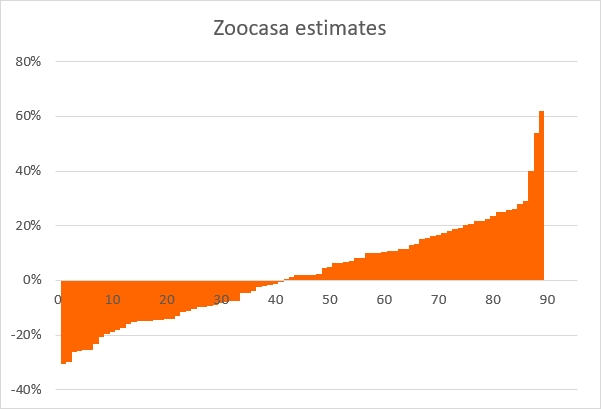
As for Zoocasa, you will note the more even mix of positive and negative estimates. You''ll also note there are sometimes it was WAY off. On a dollar amount basis, I saw Zoocasa too low by $675K on one house (guessing $1,793K on a house that sold for $2,468K), and too high by $555K on another one (guessing $1,805K on a house that sold for $1,250K). So while the average its guess was off was the closest to zero, at Zoocasa + 1.4%, it was all over the map. If you think of two cities with average annual temperatures of 20°C, there are a few different ways to get to that average. One city can be like Vancouver, that stays pretty close to that all year-round. While Zoocasa City swings all over the place from frigid -10° days to 50° scorchers (and like Toronto weather seems, you can have that in the same week!).
Here's how these bars look as lines so we can see all three at once. Where you want to be is in the grey zone, with your estimate plus or minus 5% being the sold price.
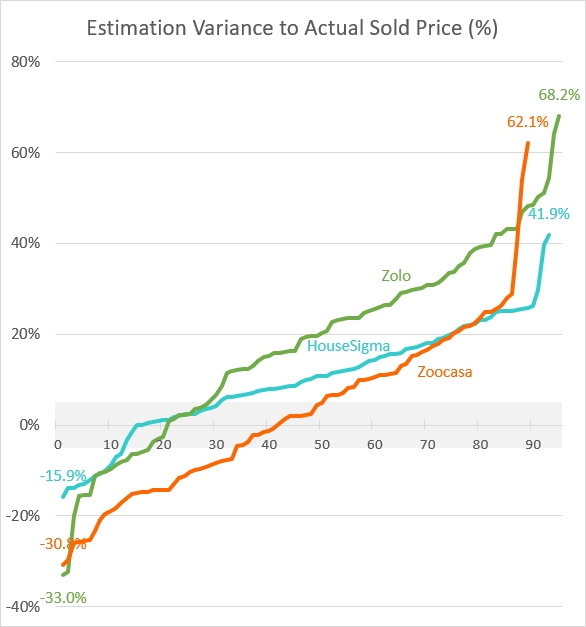
You can see above that HS had the smallest range by far (-15.9% to +41.9%), whereas Zolo had over 100 percentage points of range (-33.0% to +68.2%). If I lay it out in absolute terms (where the +/- doesn't matter and -10% counts as just 10%), an even clearer picture emerges:
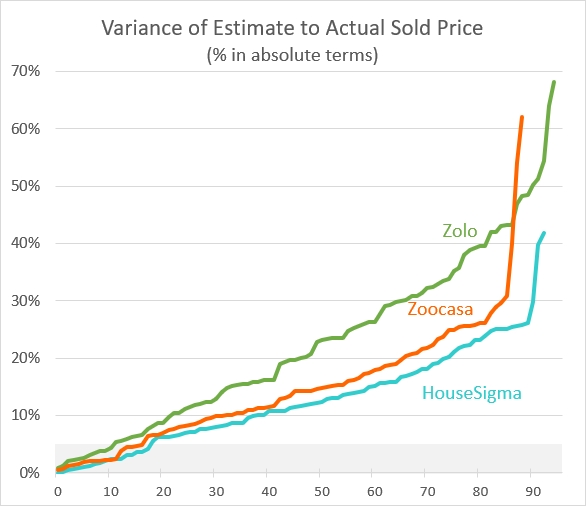
So HouseSigma spends the most time within the coveted 5% zone (and any other zone you pick, like 10% or 20%), and is generally closest. And Zolo on the other hand is the furthest away with its estimates.
So how did this shake out in terms of who had the best guess most often? Of the 95 I looked at, HS was closest on 45 occasions, Zoocasa with its wild ups and downs was closest 36 times, and Zolo lucked into 14. (If the company didn't have a guess they obviously couldn't win for that property, but I did award one to the best of the two that guessed.) Here are those numbers on a percentage share basis:
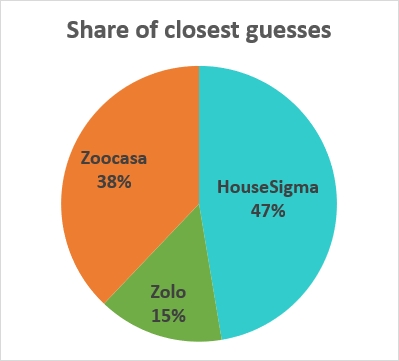
I'll add that for the 3 years that I've tracked across all 3, HS was the leading guesser in the above measure (closest guess, whether above or below) every single year.
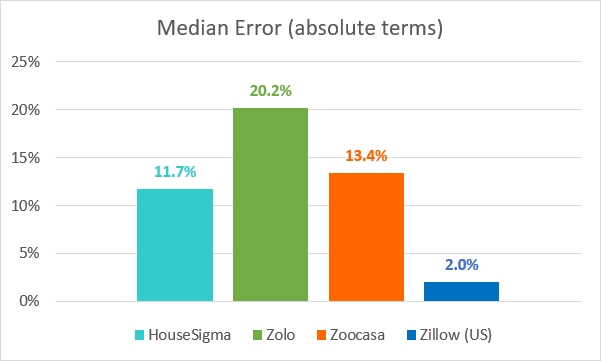
So although Zoocasa looked best in terms of being under on average by 1.4% (with HS at 9.1% and Zolo at 13.5%), if I look at the absolute values of how far the estimate was off, then take the median amount (akin to Zillow's "error margin"), the winner is HS at 11.7%, Zoocasa jumps to 13.4% away, and Zolo is 20.2% away.
![🏆]() My award goes to...
My award goes to...

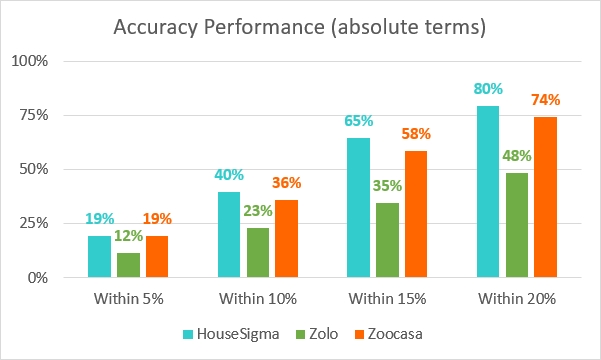
HouseSigma. By a wide margin. We've seen above that it "won" the most guesses. And we saw that it was best when you looked from an absolute value perspective, or a sort of "closest to the pin" if you will. Below is another way of looking at the absolute values. No matter which way you slice it, HS outperforms the other two.
Even though it's under 85% of the time (this year), that actually made it more dependable in a way (it was about 90% most of the year on places that were holding offers). Because HS was consistently low, there was value in using "HS + 10%" as a quick and dirty ballpark estimate (the average didn't pull under 10% until recently). With Zoocasa you never knew if it was going to be way high or way low, or (seemingly) luck out and be close. With Zolo, it had the same tendencies as HS, but was just worse. These estimators are all toys, really, but Zolo doesn't even get with 20% over half the time, so it's more like a broken toy.
HouseSigma limitations
The HS estimate is not without flaws and limitations, though. I've already pointed out that it's low 85% of the time. I should point out that it's only for Ontario properties (Zolo and Zoocasa both claim to be national in scope).
Let me talk a bit about HS's algorithms. On the HS website it states, "HouseSigma uses artificial intelligence technology to estimate home value for all available listings in the GTA." Pretty vague, right? I did a deal this year with a director at HS so I emailed them for more insight. Their response to me was:
"The estimated price is based on comparables sold using bedroom count, bathroom count, square footage, lot size, location, property type, and date sold. It is a machine learning system."
I asked how far back the machine looks for sold data and it's 6 months. I probably would've guessed less since the default period for sold info on the HS website is 90 days.
The thing I find funny, if it's based on sold data, is that when things get re-listed, the estimate seems to revise with it. You'd think that the house's value is the house's value, whether they underpriced it at $999K or at the desired $1.3M. I've seen several examples of this, but here's one from High Park North in June. On the initial list price of $1,168K, HS had an estimate of $1,389K. The sellers didn't get an offer they deemed desirable on offer night, so 8 days later they did a price change to $1520K. The new HS estimate for this same house with the same number of bedrooms and bathrooms, lot size, location, etc. but just one week later? That was $1672K. Nothing about the property changed, yet it was now deemed to be worth $283K more (a 20% increase). That seems kind of wacky to me. For the record, the Zolo estimate changed too (it went down - yes down - by $245K), and the Zoocasa one changed a bit too, but only by 2% (or $30K).
Another example is a house I helped my clients buy this fall for $1,440K. The original listing on this place was an $2,150K (ridiculous!). At that time HS had it at $1,973K. The final listing price, the one we bought it off of, was $1560K. By that time (6 months later), HS had it $300K lower at $1,676K. If anything, prices had climbed in that time. We got a good deal on this property, but not THAT good of a deal.
How do the Canadian estimators stack up against Zillow?
So we talked about how HouseSigma was the best of these three in my opinion. Now let's re-look at that chart to see how often the estimators are within 5%, 10%, and so-on, and add Zillow into the chart.
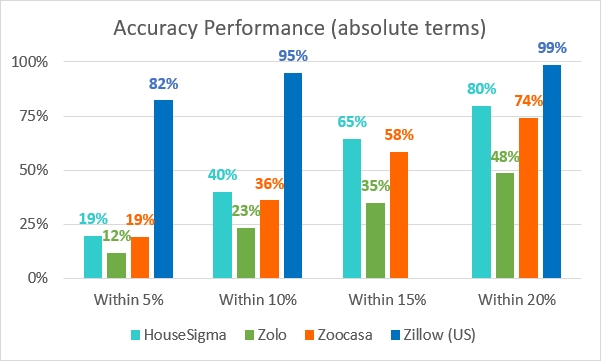
So... the Canadian threesome is not very good. To be fair to the Canadian websites, Zillow is a publcly-listed company with a market cap at time of writing of about $USD 15 billion (even after its large recent stock price decline after the unsuccessful iBuying scheme). It had over $USD 1 million to GIVE AWAY in a contest to improve its algorithm by 0.5%, for Pete's sake! I'm guessing none of the Canadian companies spent that much in their development. I'm sure Zillow has reams of mathematicians and data scientists working on algorithms around the clock. Also, to be fair, Zillow is working in US markets that are for the most part a lot tamer than Toronto. I doubt any of the US markets it tracks Zestimates for has a wild underlisting problem like Toronto with it's 65% of places selling over asking this year.
Let's go back and look at the "median error rate" for Zillow of 2.0% (1.9% for on-market homes and 6.9% for off-market homes). Plotting the Canadian companies against Zillow, the results are familiar, HS looks the best out of the Canadian ones, Zolo the worst, and Zillow is miles ahead:
The caveats
First of all, I'm only looking at 416 here, with the exception of one Markham property I am tracking.
Secondly, I'm only tracking freeholds (detached, semis and rowhouses) and no condominiums (apartments or towns). Condos are actually about 60% of the MLS sales volume in the 416. Maybe these estimators do better on condos, I don't know. Condos are a bit less challenging to price because you can make direct comparisons on many factors (age of the property, geographic location)
Next, I'm only working off of a sample of 95 here. As of November YTD there were 41,130 total 416 residential MLS sales (freeholds and condos), so I don't think I'm statistically significant here. For freeholds there were 16,041 in that time so I'm looking at a 0.6% sample.
And further to that, my sample isn't representative of the whole city because I'm only tracking places that my clients and/or I were interested in. So that's a pretty southern (not many north of Eglinton) and pretty central-to-western sample, with nothing east of Victoria Park. The breakdown of TRREB zones (W1, W2, W3 etc.) was West 42, Central 31, East 21, and the one in Markham. I was looking where my clients were looking.
A very high share of my sample of 95 were places that were holding offers (which is why I wanted to take a quick look at what it might sell for). My rate was higher than the overall sold over asking rate for 416 freeholds this year of 65%. The whole reason people use that pricing strategy is to get more money than you'd expect (i.e. estimate). So perhaps using estimates on a higher mix of places that were "offers anytime" would be more kind to the estimators.
The budgets of my clients would factor into this too. I didn't have any $10 million properties in my mix. The range that these properties sold-for (not listed-at) was from about $850K to $2450K, and the average ended up at $1,480K which is not far from the median sold price of a Toronto detached in November, which was $1,423K (the average of $1,808K gets way more press attention, I think partially because it's more sensational). Or the average semi-detached in November, which was $1,432K.
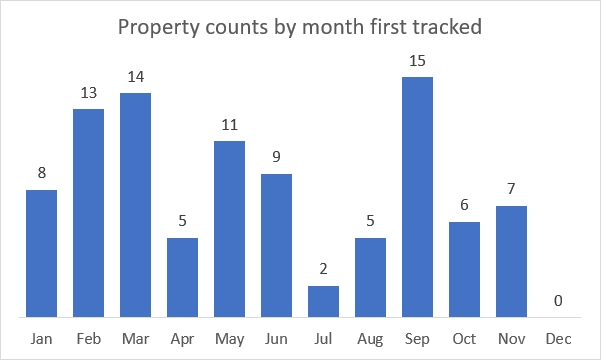
Note those average and median sold price numbers are for November, whereas my 95 sales that I tracked were distributed throughout year. So if some were in periods where rapid price appreciation was happening, that might make the algorithms look worse. Here's the time distribution:
So what I'm saying is, my study was not scientifically designed. Given the non-representative nature of my sample, your mileage may vary. But I will say that I've been tracking like this since 2018 and to use HouseSigma as an example, it was low 59% of the time in 2018, followed by 84% in 2019, 64% in 2020, and now 85% this year. So I think there is useful information you can draw from this.
In the end, the problem is this...
Consumers tend to put too much stock in the estimates. One article summed it up quite well:
While Zillow describes the Zestimate as a "great starting point" for determining the value of a home, homebuyers and sellers often believe that the Zestimate listed on a home is the true market value of the home.
The "great" description is debatable especially in the three Canadian sites I studied. But I can see why people take them as authoritative. I mean, they look so precise, at $1,142,267 or whatever. (I'm surprised they don't have cents  )
)
And they are calculated by a computer so it must be right, right? If I get some invoice from an electrician, it seems more legit when it is a typed PDF document. If they scratch out a receipt by hand I always want to check the math.
So please, the next time you're looking at one of these online estimates, remember this blog post, and that the estimate is fun to look at but not likely to be too accurate. If Zillow with its vast resources and 15 years of tweaking its algorithms "can't sufficiently trust its pricing model" and had to exit iBuying, how much do you want to trust these Canadian ones?
Top image by katemangostar on Freepik.
About Scott Ingram CPA, CA, MBA
Would you like to make better-informed real estate decisions? I believe knowledge is power. For that reason I invest a lot of time researching and analyzing data and trends in the Toronto real estate market. My Chartered Accountant (CPA, CA) side also compels me to perform a lot of due diligence work on properties my clients are interested in purchasing. If you have better information, you should have less risk and be in a position to make better decisions on the hundreds of thousands of dollars you're transacting on.
Your home is the single largest investment you'll make - trust it with an accountant.
Post a comment