

Earlier this year, Statistics Canada released some housing info for the Toronto (and Vancouver) area that had housing stock info. I previously used the information for a blog post, "How many people got burned by the 2017 correction" which ended up being used in a Globe & Mail article.
But I've been curious for a while as to just how much of Toronto's housing stock is on the market at one time, and how quickly things turn over. I did the calculations a long time ago but have had trouble finding the time to do the blog post - until now.

photo courtesy of Pexels
I'll drop a bit of background info for starters. All the assumptions in this will be in footnotes to the blog.
The housing stock
According to the Statistics Canada data there are 1,720,500 units in the Toronto Census Metropolitan Area (CMA). Here are the boundaries for the area. You can see the CMA (grey areas) are a bit different than the wider GTA which includes Burlington and more of Durham County.
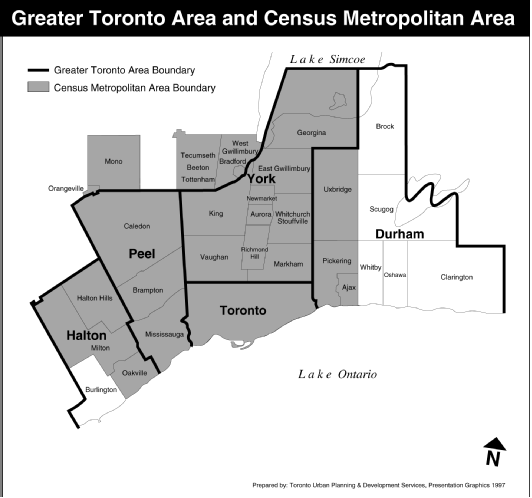
Image via City of Toronto
Here are how the 1.7 million homes split out between 416 and 905. From email conversations with Statistics Canada, the numbers were as-at May 2017:
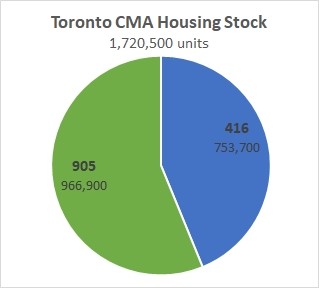
It makes sense that the 905 has more residential properties as it also holds the majority of the CMA's 6.346 million people. Note "residential properties" are different from "private dwellings" (a higher number). A house with a separate basement apartment would be one "residential property" above, but two "private dwellings" for census counting purposes. I also confirmed that an apartment building with 200 dwellings would just count as one "residential property." Stats Can said to think in terms of property tax assessment roll numbers.
Not surprisingly, the composition in the 416 is different from the 905. Here are the absolute totals, with single-detached houses being the most prevalent type (53% of the CMA's residential buildings):
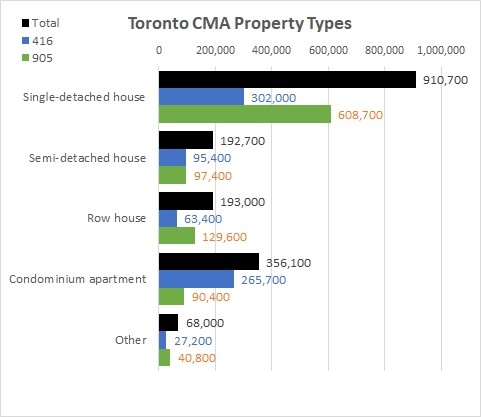
The 905 contains 2x as many detached houses as the 416, and the 416 has 3x as many condo apartment units. I've lumped some types into an "Other" category for the purposes of my study. In 416 the 27,200 for Other includes 10.5K "Property with multiple residential units" (e.g. rental buildings), 5.2K "Vacant land" and 11.5K "Unspecified property type." I've left "Other" out in this look at the composition in 416 and 905:
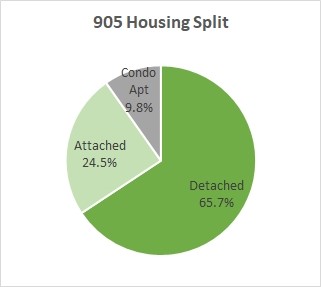
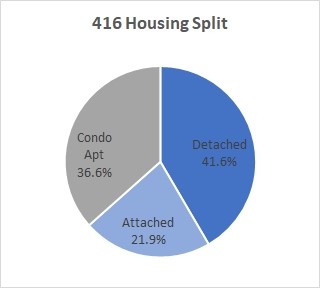
It's the blue pie chart that I'll be focusing the rest of this post on - the 460,800 lowrise houses and 265,700 condominium apartments in the City of Toronto (again, note those are the May 2017 numbers).
The availability - condo apartments
In the last 5 years, about 1.3% of the City's condominium apartments have been available for sale at any one time.
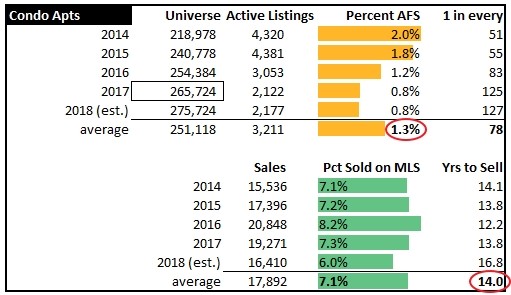
That's using an average of active listings over the course of a year. The other way to say it is, on average, 1 in every 78 condo apartments is listed for sale. With real estate being a seasonal business, the amount of active listings can vary a lot from month to month (the range in the last 5 years was from 1.277 in December 2016 to 5,208 in June 2015). You'll also note that figure has come down every year from 2.0% available for sale during 2014 to only 0.8% during the last couple of years. In absolute terms, there are about half as many condos available these past two years as there were back just a few years ago in 2014 and 2015. If you've read my blog before I've been talking about the ongoing shortage of condo apartment listings for a long time (IMO, the main thing that has kept prices buoyant in this market segment).
Now, looking to the lower part of the above table, we see annual sales of 416 condo apartments. Every year about 7% of the inventory is sold on the MLS. Private sales are not captured on the MLS, nor are new construction sales aren't captured, but they are added to the inventory numbers as they're completed. When the original pre-construction owner eventually sells the apartment on the MLS, then it is captured. If we look at average sales rates, it takes the City 14 years to turn over all the condo apartments. You'll note that, at this year's slower pace of sales, it would take 16.8 years to sell all the units once.
The availability - lowrise houses
In the last 5 years, about 0.5% of the City's lowrise houses have been available for sale at any one time. This one's a much tighter range than the condos, only varying from 0.4% to 0.6%. Put another way, over the last 5 years, 1 in 199 houses are on the market, on average.
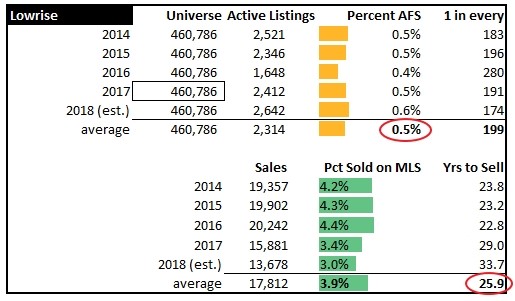
At 2018's rate of sales, it would take almost 34 years to turn over the house stock. Note that's really shot up in the last couple of years as lowrise sales are down 32% from their 2016 recent peak. The percent that turn over in a year is a much tighter range - just 1.4% from top to bottom, compared to a 2.2% range for condos apartments.
Why do condos turn over more quickly than houses?
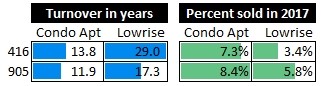
Just like we can see with the monthly market statistics, the condo and house market can and do act quite differently from one another. You can see above that condo apartments are on the market at a share 2.6 times higher than houses are (1.3% vs. 0.5% listed), and 7.1% of the stock sells in an average year versus only 3.9% for houses. That all translates into lowrise housing inventory turning over almost 12 years slower than condo apartments (25.9 vs. 14.0 years).
The most logical explanation I see is simply because condo apartments are viewed as more of a "stepping stone" property - the first rung on the property ladder. People talk about "forever houses" not "forever one-bedroom condos." I'm sure we can all think of friends (and clients) in one bedroom condos that get married and/or have a kid and decide they want more space. When you're outgrowing a house, you can finish the basement or put an addition on the back or add a floor to increase your livable space. In a condo apartment, you're stuck with that footprint so have no choice but to move if you need extra space. My grandparents lived in their house for 45 years; the longest tenure I can think of anybody I know in a condo is in the 10 to 15 year range (which may also be a function of my age, and the fact that condos didn't start becoming common in these here parts here until the eighties).
One other factor I can think of for the higher turnover in condos is the amount of investors in the space. Last year, roughly half of new condos purchased were by investors. I can't find any statistics to back this up, but I'd guess that condo investors are turning over faster than that 14-year turnover average. Many sell right after pre-construction to crystalize their gains from a pre-construction purchase, for example.
I also note in my monthly statistics that the 416 and 905 can act quite differently. I had a look at 2017 turnover rates. Interestingly 905 owners hold onto their places for shorter periods in each housing type than their 416 counterparts. The gap is particularly big in lowrise housing, with almost a 12 year difference in turnover times.
If I were to guess here, I'd say people that move to the suburbs are often looking for more space. And maybe that's an eternal quest so families may move a couple of times. And then when the kids move out the empty nesters are left with a 5 bedroom house which is really just too big for a couple, so they move again. Whereas people that live in the City may prioritize other things like walkability or lower commute times so don't prioritize this space consideration as much. That might not be as true for the inner suburbs like Don Mills or North York.
So in short, much more of the condo inventory is available for sale at any one time, and it turns over more rapidly than the housing stock. And we see that all types of housing in the 905 turn over more rapidly than the 416.
Footnotes - references and assumptions
- the Statistics Canada information on the housing stock came from Table 33-10-0003-01 (numbers are slightly different from when I downloaded several months ago, back when it was CANSIM 035-0003). Per email conversation, the numbers were at May 2017 for Toronto.
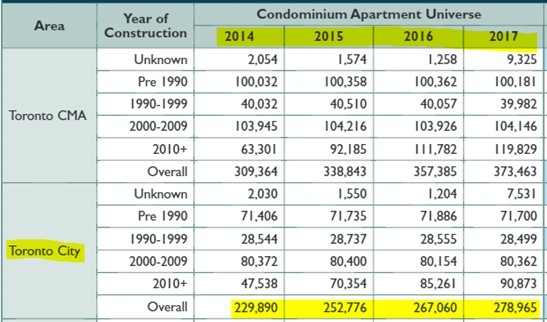
- For condominium apartment numbers, the CMHC had released annual numbers in its December 2017 Housing Market Insights report, which can be found here. They were slightly off from the StatsCan numbers so I used the StatsCan 265,724 as my base number, which was 95.25% of the CMHC's 278,965 for 2017. Then to get a number for prior years I used the CMHC number below and pro-rated to 95.25% to get a StatsCan equivalent.
- For the 2018 condominium apartment number, I added 10,000 units to the 2017 number
- For lowrise houses I made an assumption that the overall number has not changed. It's a bit of a stretch, as there is still little bits of infill happening in the 416 where you'll find a handful of "urban townhomes" being built where a service station once was, but there are not big farmer's fields left for major redevelopment.
- For active listings, I took the number for each month in the years studied (which is a snapshot on the last day of the month), and I averaged those 12 months to get the year's number. December 2018 is an estimate. I looked at what percent listings declined from Nov to Dec in 2017 and applied it to the Nov 2018 number to arrive at a Dec 2018 number.
About Scott Ingram CPA, CA, MBA
Would you like to make better-informed real estate decisions? I believe knowledge is power. For that reason I invest a lot of time researching and analyzing data and trends in the Toronto real estate market. My Chartered Accountant (CPA, CA) side also compels me to perform a lot more due diligence on properties my clients are interested in purchasing. If you have better information, you should have less risk and be in a position to make better decisions for your hundreds of thousands of dollars.
Your home is the single largest investment you'll make - trust it with an accountant.
Post a comment