

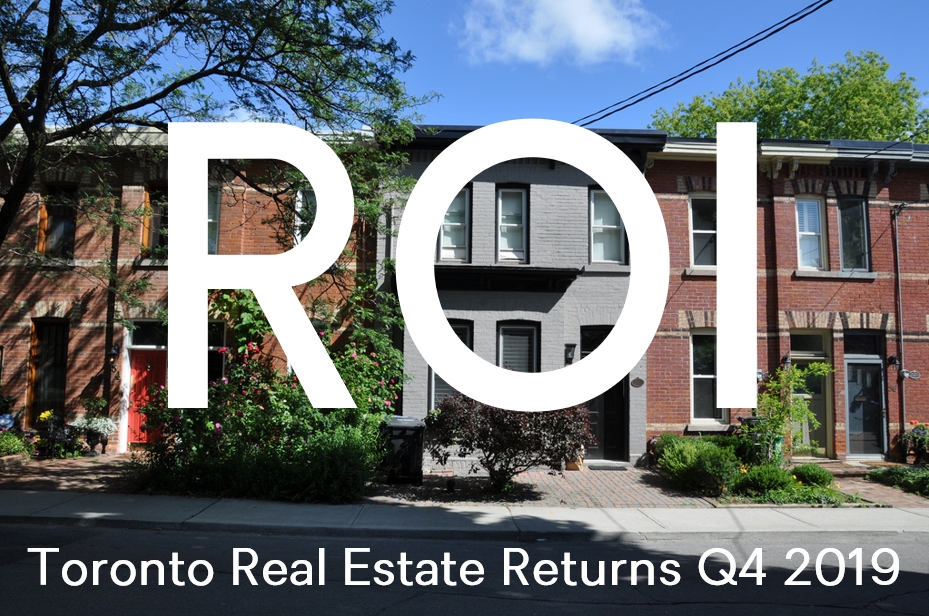
Are you curious how your house or condo has appreciated over time compared to the average in the city? Or how those average price increases look versus the stock market? Well then you came to the right place. I've been compiling this after the June and December market statistics are released. Here's where you can find the last post, for Q2 2019. I will show some of the charts in this blog post, but for the full picture, the entire report is available on the ROI reports page of my website. (And also on SlideShare.)
Disclaimerville
For the love of Pete read this before you rage out on me: I'm not claiming this is a perfect comparison. Houses aren't a liquid asset like stocks or bonds. For most people a home is primarily purchased because we all need shelter. It's also a more emotional purchase (and sale) than buying a mutual fund for your RRSP. For most it's not a pure investment vehicle, though price appreciation is certainly a welcome benefit when it occurs. This is a simplified look, purely out of curiosity, and to give a rough idea of performance versus major market indexes.
For a pure investment standpoint, a more apples-to-apples comparison would need to account for real estate transaction fees (e.g. land transfer taxes, real estate commissions, legal fees, etc.), which can be significant but percentages vary a lot from transaction to transaction. For example, on a $500,000 condo purchase in Toronto today you'd pay 2.59% LTT ($12,950 if you're not a FTHB). On a $1,000,000 home, you'd pay 3.295% one-time on top of the purchase price. But looking backwards, the percentages have had small adjustments, and Toronto's municipal LTT didn't come in until Feb 1, 2008. And some people get a rebate, so it's hard to apply a number here.
On the stock side, they should properly include dividend re-investment and also transaction fees. Dividend re-investment can easily add a few points to the stock returns. For example, using the S&P 500 index, the difference between the with and without dividends returns in 2019 was 28.26% without and 31.10% with, a difference of 2.84%. For 2018 it was -6.24% versus -4.41% with dividends, a difference of 1.83%. Here are the longer term averages for how much better S&P 500 returns when dividends are re-invested:
last 10 years: 2.37%
last 20 years: 2.08%
last 30 years: 3.07%
That's from taking a simple average, and here is my source). If those "total return" numbers were readily available for each exchange I would use them. (If you know where they are, let me know.)
You'd also factor in that in Canada you don't pay income tax on any gains on your principal residence. Another factor in real estate's favour is you can use leverage. You can't put $100K down to buy $500K of stock and have the bank loan you $400K. Well there are instruments to get leverage in the stock market but they are generally only used by sophisticated investors. Note leverage is a risky beast and it cuts both ways.
Finally, I'm using 20 years as the outer limit here because I only have monthly data from TREB from January 1996. I'm not trying to avoid a 30 year comparison to 1989 real estate heights - I just don't have that data. I know 1996 coincides nicely with when Toronto real estate turned around, but I'm showing 5, 10, 15, and 20 year returns to show as many periods over as long a period as I can.
Bounce back year for the stock markets
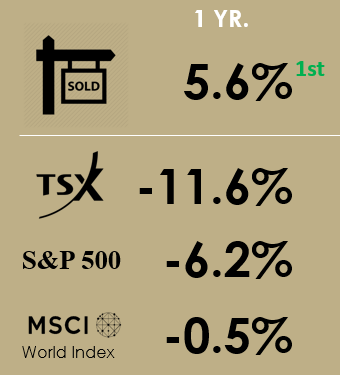
Last year for the Q4 2018 ROI post I used the headline "Rough year for the stock markets". Here are the one-year returns as at Q4 2018:
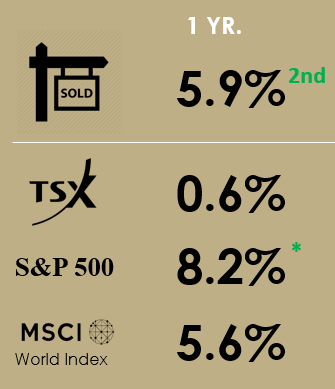
By the time I did my Q2 2019 post, the markets had all turned positive (though the TSX wasn't by much):
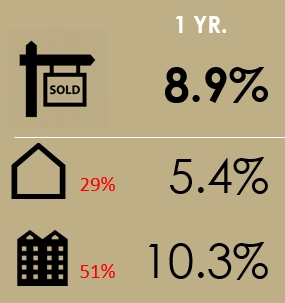
And now at Q4 2019?
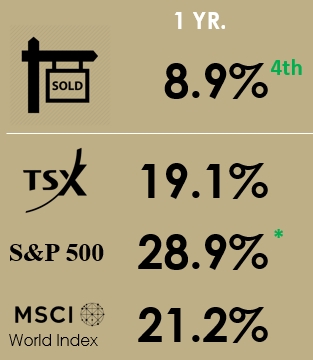
Well, given the headline for this section, the results shouldn't be surprsing. But that 8.9% return for 416 real estate (all housing types) is nothing to sneeze at. It's above the long term averages. It just looks low compared to 20%.
Methodology notes
The housing numbers compare all transactions in Q4 (October to December) versus Q4 of the prior year. Keep in mind this "SOLD" sign represents all of Toronto residential real estate, so it's essentially a portfolio of all houses and condos sold in the 416 area code (from the western edge of Etobicoke to the eastern edge of Scarborough and everything south of Steeles). In that way it's much like the indexes on this chart, which are a portfolio of stocks (albeit a subset of top stocks). And like a stock index will have winners and losers, underlying that 8.9% 416 real estate portfolio number for Q4, condo apartments were up 10.3% YoY, while detached houses were 5.4%.
Don't sleep on the effect of mix
If you average 5.9% and 10.3% you get more like 7.9% than 8.9%, so what gives?
A lot of people struggle with this. Here's an example of the effect mix can have on an average. Say there's a bar with 2 different drinks on the menu. One is an imported beer at $10, and the other is a domestic beer at $5. Say the bar sold 10 beers last night, 5 of each kind. The average transaction was $7.50. The calculation is (5x$10) + (5x$5) = $75 divided by 10 sold = $7.50. Now say tonight the bar sold 10 beers again, but this time it was 7 imports and 3 domestics. The total revenue would be $70 + $15= $85 and the average price per transaction just went up to $8.50 (a 13.3% increase). Even though the prices didn't change.
Here are some actual numbers from Q2, with 2018 on the top row and 2019 on the bottom row.

You can see that detached was flat and that condo apartments went up 5.9%. But also happening behind the scenes is that the more expensive detached houses ($10 beer) went up from a 26.9% share of the total Q2 transactions in 2018 to 29.0% in 2019, and the cheaper condo apartments ($5 beer) went from 54.5% to 50.6%. (Those two housing types combine to make up about 80% of Toronto transactions, with attached housing like semis, rowhouses, and townhouses - which is priced in between the two extremes - making up the remainder). So while the $36K condo price increase was partly why the "All real estate" number increased by $51K (from $869K to $920K), it was also helped largely by adding more of the expensive homes ($10 beer) in the mix.
Toronto real estate looks good in long term views
Toronto Real Estate (dotted brown line is composite number) is very competitive in any view you take here. From 5 years out to 23 years out (as long as I have data for), the ROI for "all real estate" in 416 ranges from 6.6% to 8.2%. From years 1 to 4 it's been consistent lately also, ranging from 6.1% to 8.9%.
That's a lot less volatile than the stock market. You can see that below, with three indexes I've tracked don't steady out to their long term range until about year 12 (and more like 15 years for the TSX).
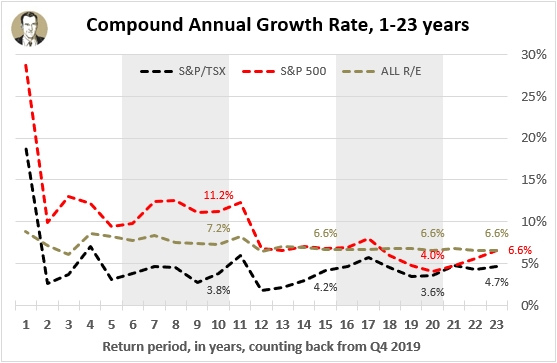
In the 23-year CAGR view (furthest out I have info for, from 1996 to 2019), the "Toronto real estate" return is 6.62%, which just noses out the S&P 500 which was 6.61%.
Taking highlights from every 5 years and putting them in a table (and adding MSCI) looks like this:
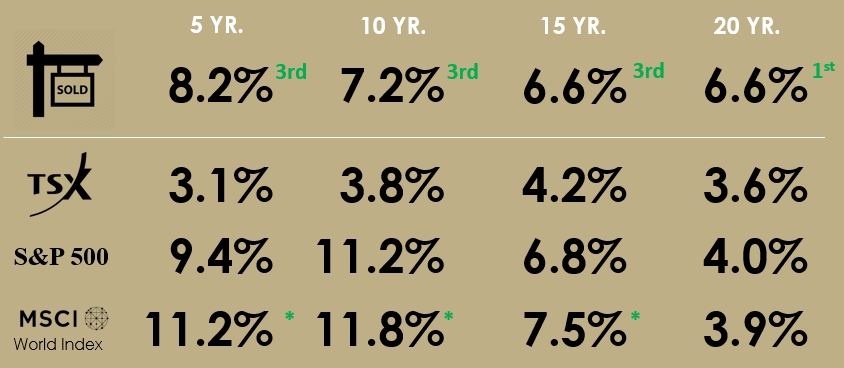
As I state in the section header, I'd call Toronto real estate competitive with these indexes in any view from 12 years onwards.
I will say that the available data coincides nicely (and I don't know if it's a TRREB conspiracy or not) with when the Toronto market began it's rebound from the 1989 bubble bursting. From it's peak in 1989, the annual average price in the GTA declined in 6 of the next 7 years. But then for 11 straight years, from 1996 to 2007, the annual average Q4 price increased. In 2008 it fell by 11.9%, and now it has had another 11 year positive streak.
Which has performed better, houses or condos?
The two most transacted housing types in the 416 are detached houses (29% of 2019 transaction) and condo apartments (51%), so that's why I've narrowed-in on them. As to which has performed better, the answer depends on your time frame. When I wrote about this at Q4 2017 detached looked better in every view of longer than 3 years (condo apartments looking better in 1 to 2 year CAGRs). Now, condos have had such a run-up that they look better in every view from 1 to 9 years.
In my Q2 ROI report, I wrote the "average condo CAGR of 10.2% over the last 5 years is due for some regression to the mean. It's already been slowing this year." Well, it stopped slowing down and picked back up and at the end of the year the 5-year CAGR was 11.1%. But really, is that sustainable when the 20-year CAGR is around 7%? Reasonably, it shouldn't be, but sometimes markets don't act rationally.
TSX has been lame
When I first ran this report, I just compared it to the TSX. That's because we're in Canada and it's in Canadian dollars so it seemed the most relevant. But a good balanced portfolio would have US equities and international ones too, so I've added them over time. It gets too crowded if I shove all the stock indexes and housing types into the same chart, so if I ever compare to one index, I still go back to the TSX. That's not because it's been the lowest performer out of the three benchmarks I look at - it's simply because I think it's still the most relevant. So for goodness' sake I'm not trying to show how good real estate is by comparing to a lame index. I'm just presenting the numbers for what they are. If real estate currently sucked and the TSX was going gangbusters, I'd still present the numbers for what they are.
More chart fun
Again, these screenshots were just excerpts. For more charts (with exciting annotations! and proper image dimensions), check out the full ROI report (and/or prior ROI reports) here on this website, or on SlideShare.
About the indexes
Descriptions per Wikipedia:
"The S&P/TSX Composite Index is the benchmark Canadian index, representing roughly 70% of the total market capitalizationon the Toronto Stock Exchange (TSX) with about 250 companies included in it. The Toronto Stock Exchange is made up of over 1,500 companies."
"The Standard & Poor's 500, often abbreviated as the S&P 500, or just the S&P, is an American stock market index based on the market capitalizations of 500 large companies having common stock listed on the NYSE, NASDAQ, or the Cboe BZX Exchange. The S&P 500 index components and their weightings are determined by S&P Dow Jones Indices."
"The MSCI World is a market cap weighted stock market index of 1,649 stocks from companies throughout the world... It is maintained by MSCI Inc., formerly Morgan Stanley Capital International, and is used as a common benchmark for 'world' or 'global' stock funds intended to represent a broad cross-section of global markets. The index includes a collection of stocks of all the developed markets in the world, as defined by MSCI. The index includes securities from 23 countries but excludes stocks from emerging and frontier economies making it less worldwide than the name suggests."
About Scott Ingram CPA, CA, MBA
Would you like to make better-informed real estate decisions? I believe knowledge is power. For that reason I invest a lot of time researching and analyzing data and trends in the Toronto real estate market. My Chartered Accountant (CPA, CA) side also compels me to perform a lot more due diligence on properties my clients are interested in purchasing. If you have better information, you should have less risk and be in a position to make better decisions for your hundreds of thousands of dollars.
Your home is the single largest investment you'll make - trust it with an accountant.
Post a comment