

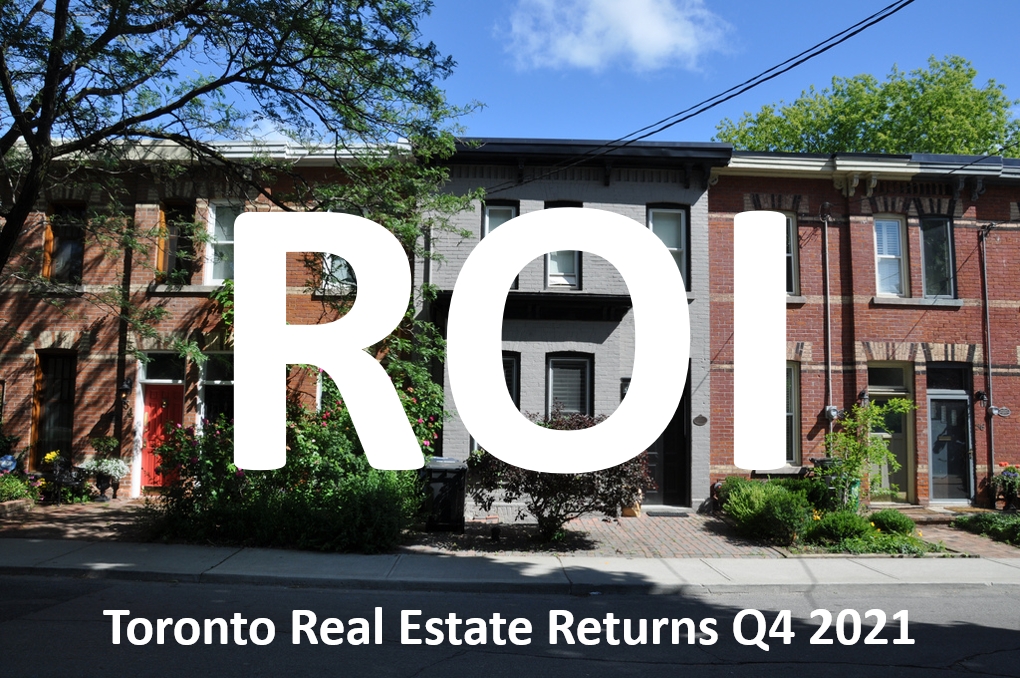
Are you curious how your house or condo has appreciated over time compared to the average in the city? Or how those average price increases look versus the stock market? Well then you came to the right place. I've been compiling this after the June and December market statistics are released, going back to 2016 (historical reports here). But it's been a minute since my last post on this, for Q4 2019. That post is still getting a lot of reads, so I figured I really should update it.
I will show select charts in this blog post, but for the full picture, the entire report is available on the ROI reports page of my website.
Disclaimerville
For the love of Pete read this before you rage out on me: I'm not claiming this is a perfect comparison. Houses aren't a liquid asset like stocks or bonds. For most people a home is primarily purchased because we all need shelter. It's also a more emotional purchase (and sale) than buying a mutual fund for your RRSP. For most it's not a pure investment vehicle, though price appreciation is certainly a welcome benefit when it occurs. This is a simplified look, purely out of curiosity, and to give a rough idea of performance versus major market indexes.
For a pure investment standpoint, a more apples-to-apples comparison would need to account for real estate transaction fees (e.g. land transfer taxes, real estate commissions, legal fees, etc.), which can be significant but percentages vary a lot from transaction to transaction. For example, on a $500,000 condo purchase in Toronto today you'd pay 2.59% LTT ($12,950 for non-FTHB). On a $1,000,000 home, you'd pay 3.295% one-time on top of the purchase price ($32,950). But looking backwards, the percentages have had small adjustments, and Toronto's municipal LTT didn't come in until Feb 1, 2008. And some people get a rebate, so it's hard to apply a number here.
On the stock side, they should properly include dividend re-investment and also transaction fees. Dividend re-investment can easily add a few points to the stock returns. For example, using the S&P 500 index, the difference between the with and without dividends returns in 2021 was 26.89% without and 28.83% with, a difference of 1.94%. For 2020 it was 16.26% without versus 18.38% with dividends, a difference of 2.10%. Here are the longer term averages at the end of 2021 for how much better S&P 500 returns when dividends are re-invested:
last 10 years: 2.36%
last 20 years: 2.18%
last 30 years: 2.26%
That's from taking a simple average, and here is my source). If those "total return" numbers were readily available for each exchange I would use them. (If you know where they are, let me know.)
You'd also factor in that in Canada you don't pay income tax on any gains on your principal residence. Another factor in real estate's favour is you can use leverage. You can't easily put $100K down to buy $500K of stock and have the bank loan you $400K (unless you're using your HELOC). There are instruments to get leverage in the stock market but they are generally only used by sophisticated investors. Note leverage is a risky beast and it cuts both ways.
Finally, I'm using 20 years as the outer limit here because I only have monthly data from TREB from January 1996. Just this year I now have enough to do 25 year returns, but I didn't want resize all of my slides to squeeze an extra column in, given the difference between 20 year returns and 25 year returns are so minor (0.2% for S&P 500, 0.0% for TSX, 0.4% for MSCI, 0.3% for Toronto real estate). But anyway, I'm not trying to avoid a comparison to 1989 real estate heights - I just don't have that data. I know 1996 coincides nicely with when Toronto real estate turned around, but I'm showing 5, 10, 15, and 20 year returns and that's a long amount of time.
Strong year for the stock markets
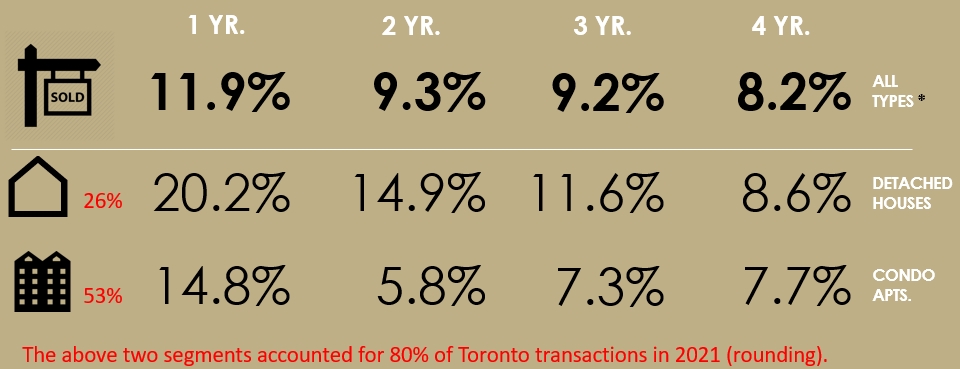
Any time you have double-digit returns in real estate, that's a big year for gains (especially at our high price levels now). But the stock markets really made hay with all of that cheap money floating around out there. Here are the one-year returns as at Q4 2021:
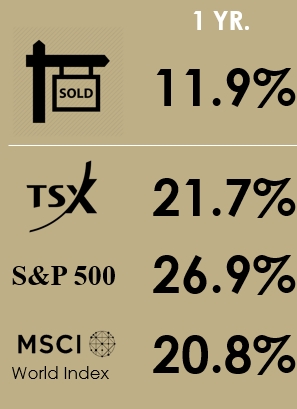
To the moon!
Methodology notes
The housing numbers compare all transactions in Q4 (October to December) versus Q4 of the prior year. Keep in mind this "SOLD" sign represents all of Toronto residential real estate, so it's essentially a portfolio of all houses and condos sold in the 416 area code (from the western edge of Etobicoke to the eastern edge of Scarborough and everything south of Steeles). In that way it's much like the indexes on this chart, which are a portfolio of stocks (albeit a subset of top stocks).
Note that when I break out the house icon and apartment icon I'm just showing detached houses and condominium apartments there, since they are the two largest segment of the 416 market (80% of sales in 2021 between them). The "All Toronto real estate" represented by the sold sign also includes semi-detached houses, rowhouses, and condo townhouses.
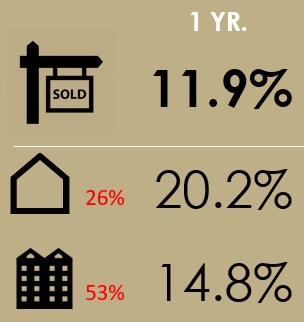
You may think it's strange that the "All RE" number is lower than the detached and condo apt numbers. Shouldn't it be in the middle? Well...
Don't sleep on the effect of mix
The major reason why the total number is lower than the individual numbers for detachand and condo apartments? The mix, and the return of condo sales.
A lot of people struggle with this. Here's an example of the effect mix can have on an average. Say there's a bar with 2 different drinks on the menu. One is an imported beer at $10, and the other is a domestic beer at $5. Say the bar sold 10 beers last night, 5 of each kind. The average transaction was $7.50. The calculation is (5x$10) + (5x$5) = $75 divided by 10 sold = $7.50. Now say tonight the bar sold 10 beers again, but this time it was 7 imports and 3 domestics. The total revenue would be $70 + $15= $85 and the average price per transaction just went up to $8.50 (a 13.3% increase). Even though the prices didn't change.
In Q4 of 2020, condo apts were 29% of all sales and detached were 18%. In 2021, Q4 condo apt volume incerased 23% over last year while detached volume decreased 9%. As a result, in Q4 2021 condo apts shot up to 47% of sales and the detached share was 22%. That'll do it.
So the $5 beer went from 29% to 47% of sales, and the $10 beer remained fairly stable changing from 18% to 22%. Or think about condo apartments (cheapest housing type by far) versus the other types (all low-rise housing). The low-rise share dropped from 71% in Q4 2020 to just 53% in Q4 2021. That had the effect of *ahem* watering down the average price.
Toronto real estate holding its own in long term views
It was really interesting to see how this chart changed in just two years, considering it's a very long term chart. Here's the Q4 2019 version:
From about year 12 through 23, Toronto Real Estate (dotted green line is composite number) was either the best choice or close to it. The longest time frame view had Toronto RE at 6.62%, just nosing out the S&P 500 at 6.62%. The TSX was behind RE except for the 1-year view.
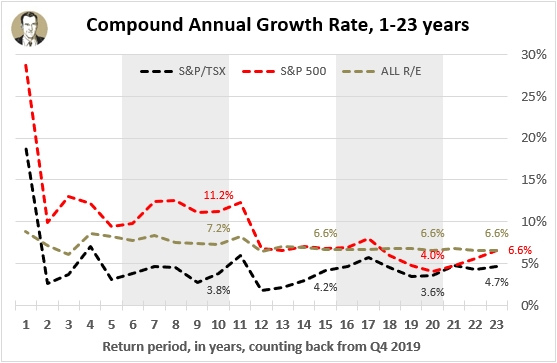
Now here's that chart updated and looking back 25 years from today:
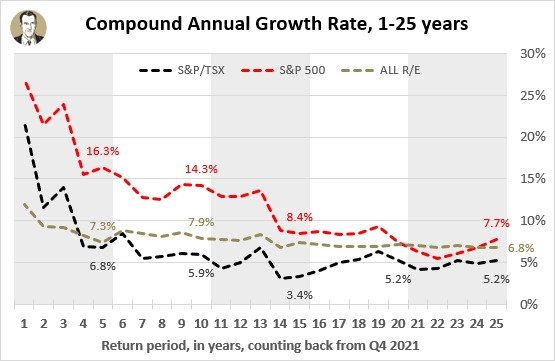
In this view, the S&P 500 would've been your best bet except for 21 to 23 years ago, when Toronto RE would've got you to the highest number today. To simplify the chart I left the MSCI returns out here (and I think Canadians watch the S&P and TSX a lot more closely anyway), but for the record, teh 25-year return for it is 7.2%, nestling in between the S&P 500 (7.7%) and Toronto RE (6.8%). The TSX has lagged in this period, which is less of an issue now that the Canadian government eliminated the Canadian content restrictions for RRSPs back in 2005.
The TSX returns are above Toronto RE in the 1, 2, and 3-year views now.
Which has performed better, houses or condos?
The two most transacted housing types in the 416 are detached houses (26% of 2021 transaction) and condo apartments (53%), so that's why I've narrowed-in on them. As to which has performed better, the answer depends on your time frame.
In all views 7 years and under, condo apts have a better CAGR than detached house prices (year 7 is essentially tied at 9.5% though when you go one digit deeper the condos edge out). But if you take the long term view, it's detached housing:
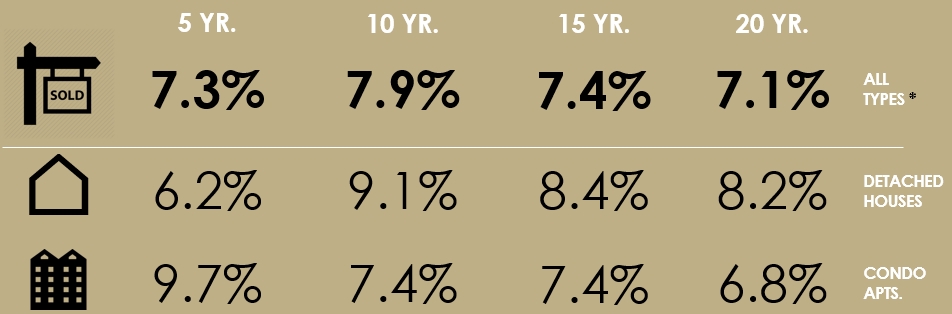
To me, when I see the recent year run-ups of condo apt prices far above the long term average, I see that as a risk that they'll regress to the mean. We'll see how that plays out.
One other thing that really sticks out to me is just how much more stable RE returns than the stock market. Here's a chart of rolling 5-year returns.
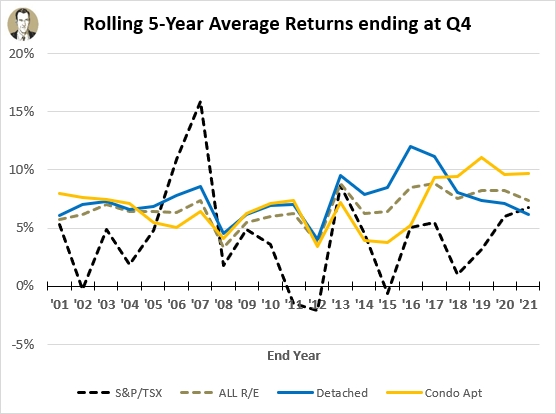
Real estate is generally staying in the 5% to 10% range in all 5-year periods over the last 21 years. In fact the "All Real Estate" number was in that range in 19 of 21 years. Detached (blue) has popped above it twice, and condo apts (yellow) went above once. None of the RE looks had a negative 5-year run, and the lowest was the All RE number with a 3.3% CAGR for the 5-year period ending Q4 2008.
On the other hand the TSX has had 4 negative 5-year periods, and only 6 of 21 were in that stable 5% to 10% range (13 below, 2 above).
More chart fun
Again, these screenshots were just excerpts. For a more robust view, check out the other charts (with exciting annotations! and proper image dimensions), in the full ROI report (and/or prior ROI reports) here on my website, (and some of my older ones are still up on SlideShare, if that's your jam).
About the indexes
Descriptions per Wikipedia:
"The S&P/TSX Composite Index is the benchmark Canadian index, representing roughly 70% of the total market capitalizationon the Toronto Stock Exchange (TSX) with about 250 companies included in it. The Toronto Stock Exchange is made up of over 1,500 companies."
"The Standard & Poor's 500, often abbreviated as the S&P 500, or just the S&P, is an American stock market index based on the market capitalizations of 500 large companies having common stock listed on the NYSE, NASDAQ, or the Cboe BZX Exchange. The S&P 500 index components and their weightings are determined by S&P Dow Jones Indices."
"The MSCI World is a market cap weighted stock market index of 1,649 stocks from companies throughout the world... It is maintained by MSCI Inc., formerly Morgan Stanley Capital International, and is used as a common benchmark for 'world' or 'global' stock funds intended to represent a broad cross-section of global markets. The index includes a collection of stocks of all the developed markets in the world, as defined by MSCI. The index includes securities from 23 countries but excludes stocks from emerging and frontier economies making it less worldwide than the name suggests."
About Scott Ingram CPA, CA, MBA
Would you like to make better-informed real estate decisions? I believe knowledge is power. For that reason I invest a lot of time researching and analyzing data and trends in the Toronto real estate market. My Chartered Accountant (CPA, CA) side also compels me to perform a lot more due diligence on properties my clients are interested in purchasing. If you have better information, you should have less risk and be in a position to make better decisions for your hundreds of thousands of dollars.
Your home is the single largest investment you'll make - trust it with an accountant.
Post a comment