This is the second post in a two-part series taking a deep dive into 2019 neighbourhood statistics. The first part listed Toronto's most and least expensive neighbourhoods and featured an interactive heat map with the average detached home price in each Toronto neighbourhood. This post will look at where prices are rising and falling the steepest. I took the same look at this last year, as well as back in 2016.
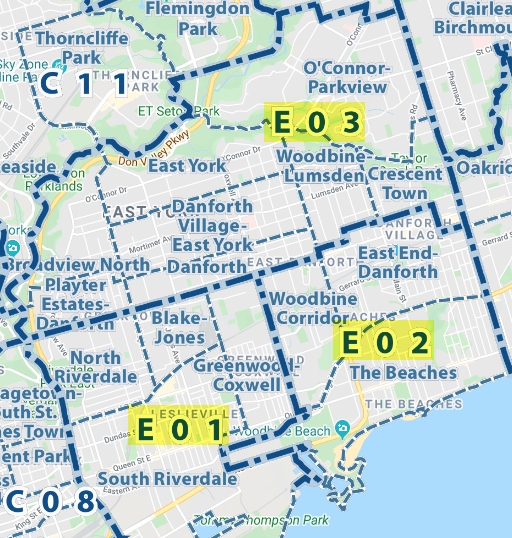
In this analysis, I'm looking at just average detached house prices. It keeps things a little more apples-to-apples across the city. Detached is the most prominent housing type in the 416, consistently running at around 70% of 416 freehold MLS sales. And again, I'm looking at all 144 TREB neighbourhoods (e.g. Leaside, Mimico, Annex), which are spread across 35 zones (W04, C01, E`1, etc.) within the City of Toronto boundaries (49 west, 54 central, 41 east). You can view a map with TREB zones here (and zoom in for detail).
For list ranking purposes, I only included the 130 neighbourhoods that had 10 or more detached house sales in 2019. You'll find the 14 excluded neighbourhoods and some more notes on methodology at the bottom of the post.
The heat map
Here are all of the neighbourhoods mapped out, with hotter neighbourhoods (large % price increases) getting darker red, and colder (steeper % price decreases) getting darker blue. You'll find some more map background in the first part of this two part series (near the bottom), if you haven't read it. Lists and analysis to follow:
Some city-wide context
For context, here's how the 416 detached average prices has progressed in the last few years:
2015: $1,047,400
2016: $1,252,300 (+20%)
2017: $1,421,000 (+13%)
2018: $1,321,800 (-7%)
2019: $1,319,000 (-0%)
Though the overall average detached price was flat to 2018, the average price in the median neighbourhood increased from $1,053K in 2018 (E01 Greenwood-Coxwell) to $1,110K in 2019 (W06 Long Branch and E03 East York).
The median neighbourhood year-over-year (YoY) percentage increases for the last four years were:
2016: 19.6%
2017: 14.1%
2018: -3.3%
2019: 4.1% (E09 Morningside and E03 Crescent Town)
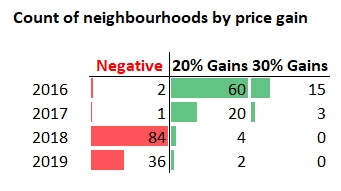
The medians were close to the overall numbers in 2016 and 2017, but about 4% different the last couple of years. You can see things shot up pretty rapidly in 2016 and 2017, and 2018 reversed a bit, and last year (2019) was moderate. But those are a lot slower than 2016 or 2017 detached price increases. Another way to show we're in a different world is to count the qualifying neighbourhoods (10+ detached sales) that were negative or that had big gains. You can see it's a lot different story the last couple of years than the couple of years before that.
There were virtually no negative neighbourhoods in 2016 and 2017, but about 2/3 were in 2018 and about 1/4 last year. And way less big gainers (+20%) the last two years, and no crazy gainers (+30%).
The list: Top percentage gainers of 2019 ![]()
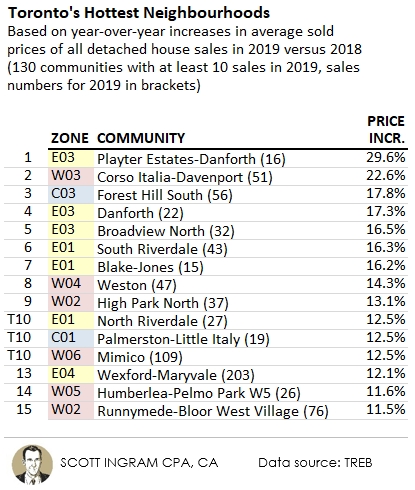
For your list-reading pleasure, here are the 15 neighbourhoods from the above map with the highest price growth percentage of 2019 over 2018.
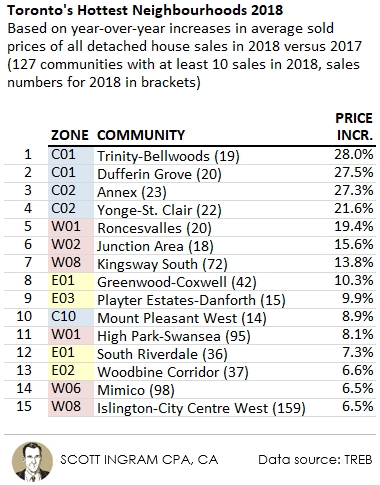
In 2016, 13 of the top 15 were central. In 2018, the top 4 were all central. By the way I'm using a colour code of red for west, blue for central, and yellow for east. This year you'll note that 5 of the top 7 were in the east. Moreover, only 2 central neighbourhoods made it into the top 15. over 2017.
![]() List star: Playter Estates-Danforth at #1
List star: Playter Estates-Danforth at #1
Let's touch upon the neighbourhood in the number one spot, E03 Playter Estates-Danforth ("PED"). One big change from the heated 2016 to now is that this fastest growing Playter Estates-Danforth (+29.6%) wouldn't have made even made the top 15 in wacky 2016 (it would've been 16th). Why is PED gaining in popularity? I see three big reasons:
- People have been looking to the east for cheaper prices, and PED is just over the DVP.
- It is close to the subway, which people that look to the east all desire.
- It is home to Jackman Avenue Junior Public School, which has consistently high Fraser Institute rankings (a 9.0 as recently as 2017). I found 93 listings in the last 24 months that specifically mentioned Jackman as a selling feature.
You will note PED only had 16 detached sales (10 is my cut-off to be ranked). I made a similar note in my most expensive neighbourhoods post, but be a little wary of hoods with less transactions. That's because a few big (or little) transactions can really mess with the average. In 2018 there were only 3 sales over $2 million. Last year 4 of those 16 sales were over $3 million and it seems to me like those houses just weren't on the market in 2018. I could see this neighbourhood falling in average price in 2020. That's a lot different than saying that property values are falling; it's just a limitation of using averages, because the underlying mix is important.
Re-visiting the 2018 list, the top 6 neighbourhoods all had between 18 and 23 transactions.
Well, 4 of those top 6 had the average price go down in 2019. Three you will see below in the "coldest" list (C01 Dufferin Grove, C02 Annex, C02 Yonge-St. Clair). That's not to say that these neighbourhoods suddenly became less desirable, but was more likely a matter of the mix of homes (i.e. a larger share than normal of bigger more expensive ones were on the market in the "hot list" year).
![]() List star: Mimico repeats
List star: Mimico repeats
The thing that makes Mimico noteworthy is not that it was tied for 10th spot in 2019. If you look again at the "hot list" from 2018 above, you will see that there are two neighbourhoods that made that list and the 2019 list. One we just talked about in Playter Estates-Danforth. The other is W06 Mimico, which is situation between the Gardiner Expressway and Lake Ontario, just west of the Humber River.
Mimico has gained a lot in popularity for a few different reasons:
- SanRemo Bakery (okay maybe that's just the number one reason for me - but when I'm doing a showing in Mimico I always pop by. It's been around since 1969 and is a local mom and pop institution.)
- Gardiner access - you can be downtown in less than 15 minutes in no traffic
- Mimico GO station - it's a 17 minute ride to Union Station
- Lake Ontario - there is a lot of parkland along this stretch of the water that many Mimico residents are within walking distance of
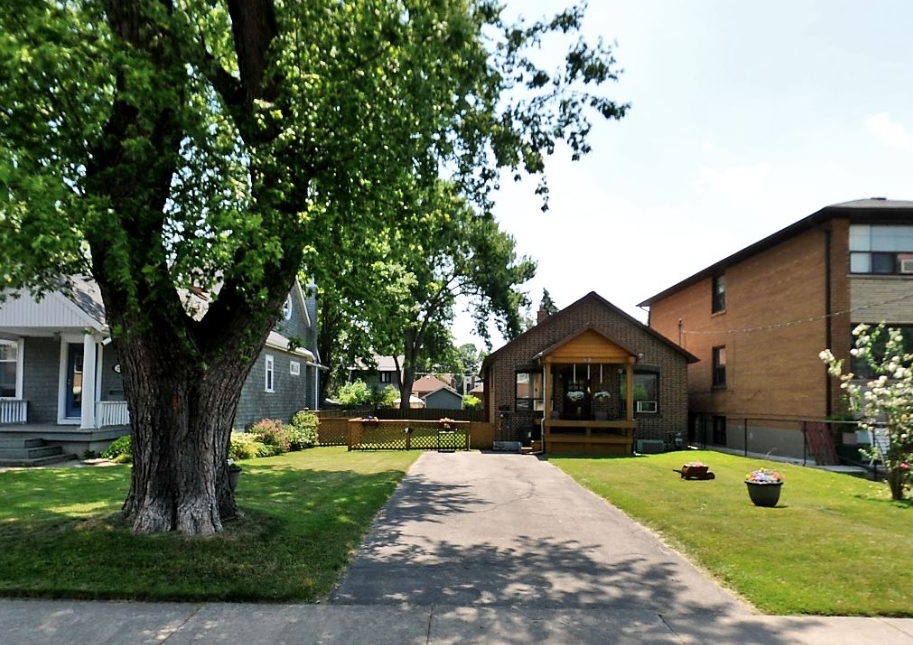
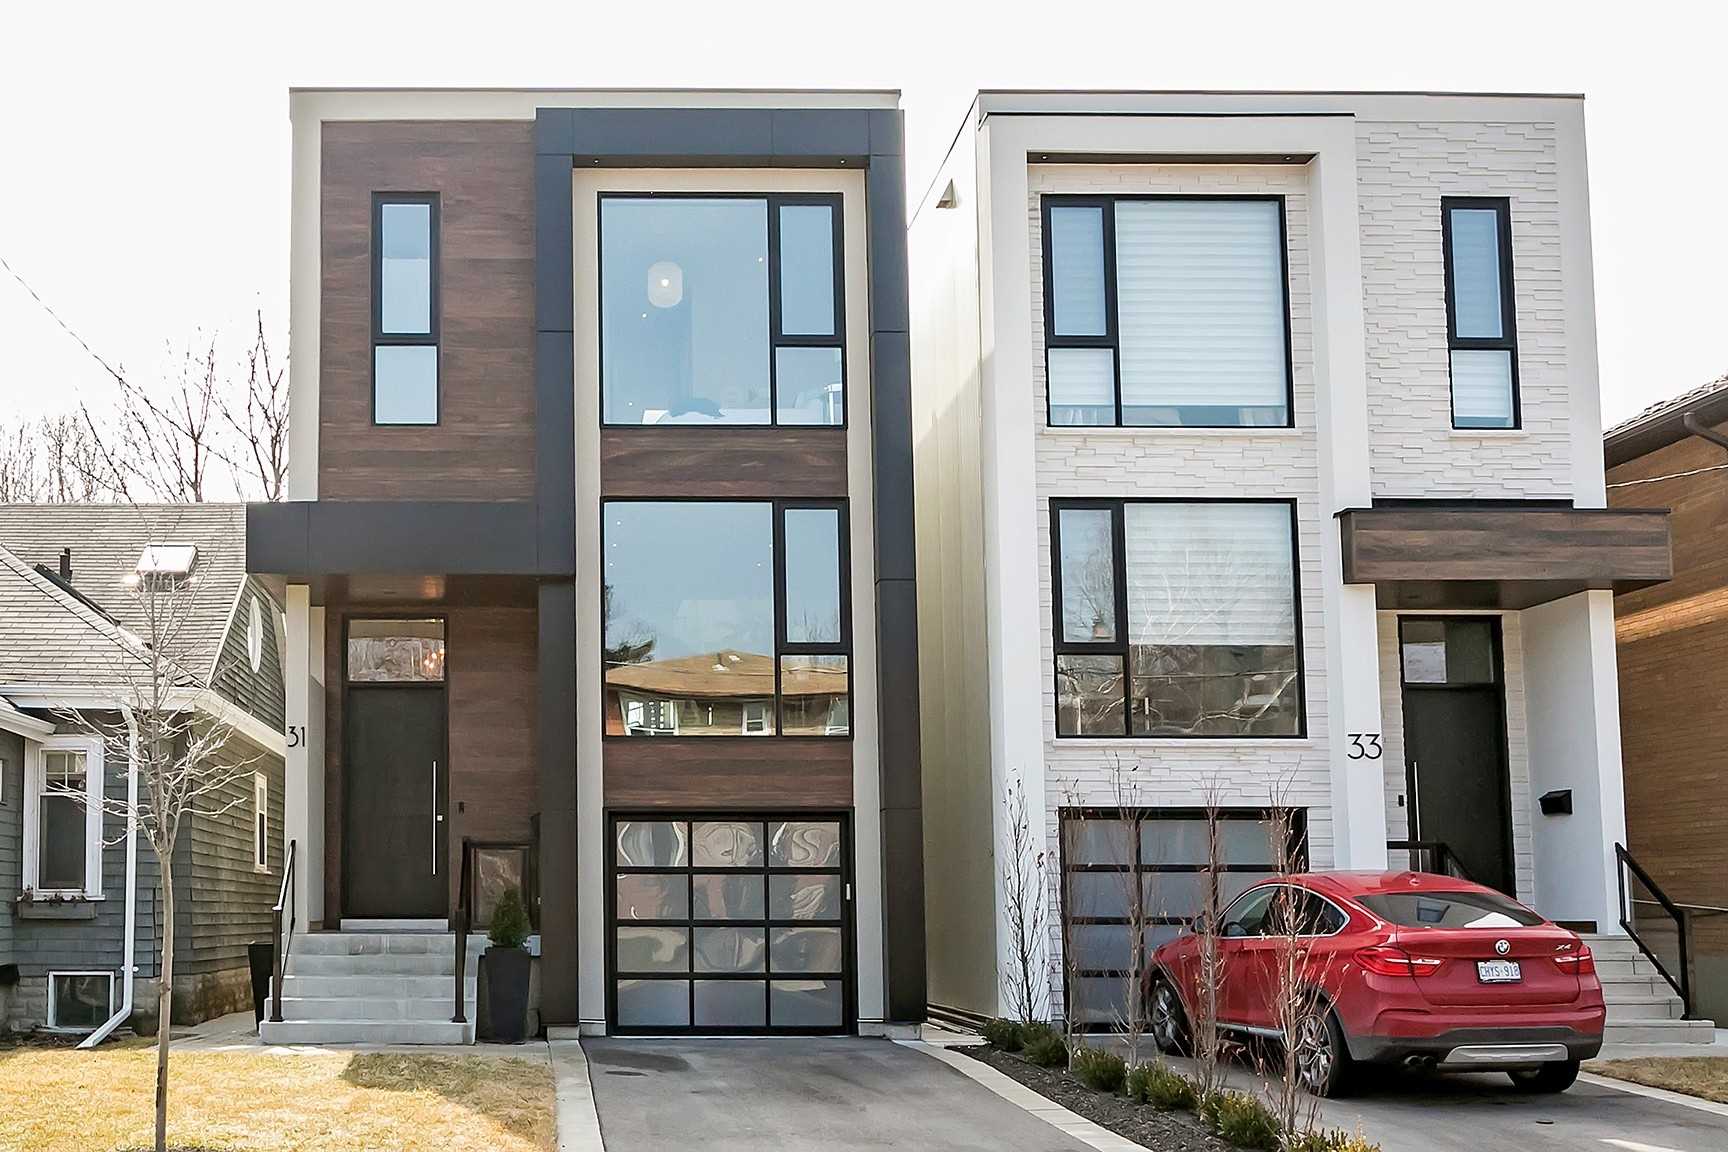
One of the reasons I think is underlying the price increases is because you see a lot of renovation and teardown activity happening here. Here's an example. This is a bungalow on a 50' wide lot as seen in 2012.
The lot was severed into two 25' wide properties and they sold for about $500K each in 2015. Then a builder erected a modern box on each lot and sold 31 Heman and 33 Heman in 2019 for around $1.7 M each.
So that's driving up the average sale in the neighbourhood. If the average price went up 10% it's not saying every house went up 10%. There can be several underlying factors, and teardowns and flips are a big factor in Mimico.
And the largest dollar gainers ![]() are...
are...
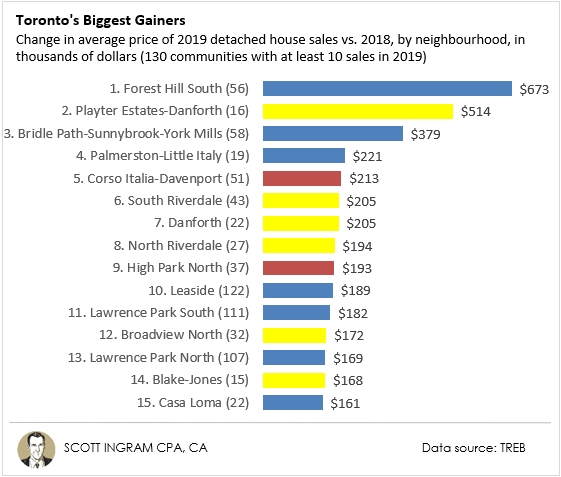
Here's the top 15. This list has a lot of overlap with the percentage list above, with 10 of the top 15 appearing on both lists. The exceptions are lower priced neighbourhoods like W04 Weston (the only one in the top 12 percentage gainers to not be below), as well as W06 Mimico, E04 Wexford-Maryvale, W05 Humberlea-Pelmo Park, and W02 Runnymede-Bloor West Village (which just missed at #17).
Last year's West-Central-East mix in the top 15 was 4-8-3 with the top 4 spots being Central. This year the mix is 2-7-6, so a bit of a shift towards the east, but still 3 of the top 4 being Central neighbourhoods (due to them being high dollar areas).
There are two neighbourhoods that pulled off the impressive #back2back on the top 15 list:
- E03 Playter Estates-Danforth (#10 and +$157K in 2018, #2 and +$517K in 2019)
- E01 South Riverdale (#15 and +$85K in 2018, #6 and +$205K in 2019).
It was more common to be in the larget price drops list in 2018 and the largest price gains in 2019. This can happen due to mix, and with these all being in the top 8 most expensive and having 2019 average values from $2.6 million to $4.8 million, you're starting with big bases so percentage swings will tranlate into high absolute dollar amounts. The three to pull off the bottom list to top list feat were:
- C12 Bridle Path-Sunnybrook-York Mills was -$533K in 2018 but partially rebounded to be +$379K in 2019
- C04 Lawrence Park South was -$522K in 2018 but +$182K in 2019
- C03 Forest Hill South was -$307K in 2018 and +$673K in 2019 (#1 gainer) - this one's a $4.4 million hood though
The biggest dollar losers
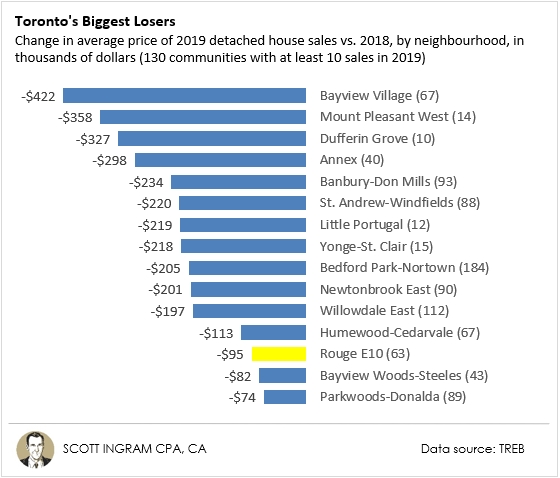
The biggest thing that jumps out here is that these are Central-dominated, with 14 of the bottom 15 coming from the Central neighbourhoods (which are more expensive).
Now 7 of those are in the north and bounded roughly by Yonge to Victoria Park and Steeles to Eglinton. These areas had higher run-ups (due to speculation) in the 2016 to 2017 madness, and are now coming down harder. Six of those 7 are #back2back on the biggest losers list: C14 Newtownbrook East and C15 Bayview Woods-Steeles at the top, C14 Willowdale East just below that, then C12 St. Andrew-Windfields and C13 Parkwoods-Donalda right under the 401 and C13 Banbury-Don Mills right below that.
Fully 5 of the biggest droppers list appear to be partially leveling off from being on the biggest gainers from last year. This includes three that only had 14 to 22 transactions so are more prone to wild swings:
- C02 Annex was the #1 gainer last year +$663K and just gave back $298K of it (#4 loser)
- C01 Dufferin Grove was the #4 gainer last year +$380K and just gave back $327K (#3 loser)
- C10 Mount Pleasant West was the #9 gainer last year +$172K and went down by $358K this year (#2 loser)
The other two had higher detached transaction numbers so I have more confidence in the change in direction. They were also lower down the list both years. Those two hoods were: C04 Bedford Park-Nortown (160 sales) and C03 Humewood-Cedarvale (60 sales).
The list: Toronto's Coldest Neighbourhoods ![❄]()
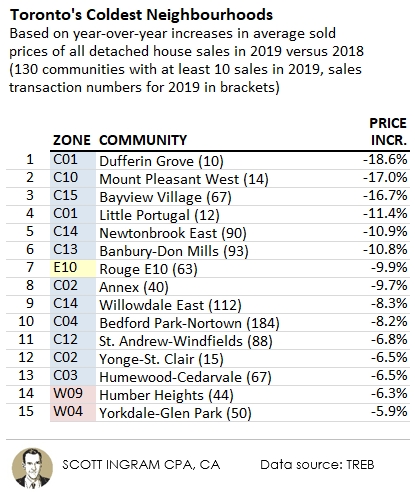
Here are neighbourhoods were the average price of a detached home dropped the largest percentage last year. Again, exercise caution when there are lower transaction numbers. C01 Dufferin Grove, C10 Mount Pleasant West, C02 Annex, and C02 Yonge-St. Clair were all on the hottest list last year but have low transaction volumes so are subject to bigger swings.
The ones to be more concerned about are the ones that made this dubious list last year as well. I'm looking at you, #back2back neighbourhoods:
- C14 Newtonbrook East (down 17.5% in 2018, down a further 10.9% in 2019)
- C13 Banbury-Don Mills (down 17.7% in 2018, down a further 10.8% in 2019)
I discussed those two above as part of that group that was also on the biggest dollar losers list twice in a row.
The other thing that jumps out is that 12 of the biggest 13 droppers were Central. Last year it was 10, but they were all in the north.
Where have houses been selling the quickest?
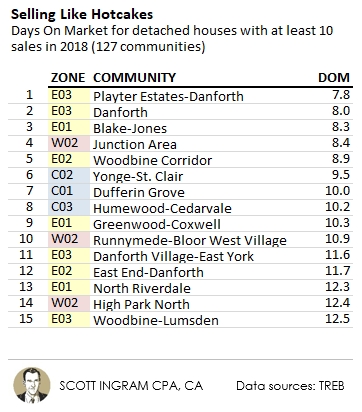
Since I have the data, let's take a look at the list of which neighbourhoods had homes sell the quickest. The statistic is called Days On Market ("DOM") and if a home hits the MLS on Monday and sells Wednesday, that counts as 2 DOM. If it sold that first day, Monday, it would be zero DOM. The second thing to note is that it's always going to be understated because of how TREB tracks it. If a house was listed for 30 days and didn't sell and the agent terminates the listing and brings it out with a new MLS number and sells it in 4 days, the official DOM that is record is 4 DOM (not the 34 total DOM it was available for sale). So that in mind, here's the hot list:
You can see the near east (E01, E02, E03) dominate this list with 9 of the top 15 spots. The comments I made for Playter Estates-Danforth hold true here. The reason why there is so much demand for these neighbourhoods is that the prices are cheaper than in the central and west areas, they are relatively close to downtown (starting just east of the DVP), and getting downtown by transit is pretty direct with several streetcar routes as well as subway stops along The Danforth (plus down the road the Downtown Relief Line or the Ontario Line or whatever the final name will be if and when it ever gets built).
Nine from this year's top 15 were also on last year's top 15, and the top 4 this year were also the top 4 last year.
Did the competition evidencenced in this list translate on the hot list for price appreciation percentage? Six of these low DOM neighbourhoods were on the top 15 hottest neighbourhoods including Playter Estates-Danforth, which was #1 on both lists - despite having an average detached price of over $2.3 million. I say despite because often these houses sell quickly because there are a lot more qualified buyers at the enry level of the market than there are for $2 million homes. Yonge-St. Clair is a weird one on here too, with an average price of $3.1 million.
Where can you take your time to buy?
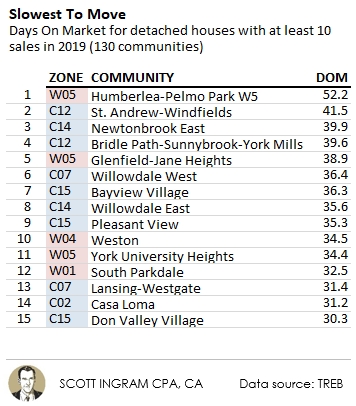
Here's the flipside, where detached houses took the longest to sell in 2019:
These ones mainly fall in three main camps.
- Expensive neighbourhoods where there isn't a big buyer pool because not too many people can afford that high a price. Also, you get a lot of highly-customized homes (think Drake's Bridle Path mansion with its regulation-sized basketball court), which take longer to find a suitable buyer for. Five on this list are $2 million and up neighbourhoods or more.
- Neighbourhoods with falling prices and sellers are holding onto hopes of getting what their neighbours got before. Four on this list were on the top 15 coldest list, and some overlapped with point #1.
- Neighbourhoods that are a bit rough around the edges, which shrinks the potential buyer pool. A few on this list fit that bill.
Notes on methodology
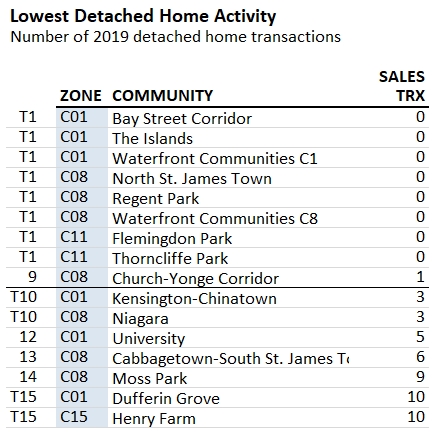
Data relates to the City of Toronto only (416). Only detached homes were used, to attempt the best possible “apples-to-apples” comparison. The “Top 15” lists exclude the 14 TREB neighbourhoods (of 144) with less than 10 detached house sales in 2019 (there were 17 excluded in 2018). Here's a list of the lowest 15 detached sales, of which the 14 under 10 were excluded from the analysis above. For the most part the housing in these areas are dominated by purpose-built rental apartments or condominiums.
About Scott Ingram CPA, CA, MBA
Would you like to make better-informed real estate decisions? I believe knowledge is power. For that reason I invest a lot of time researching and analyzing data and trends in the Toronto real estate market. My Chartered Accountant (CPA, CA) side also compels me to perform a lot more due diligence on properties my clients are interested in purchasing. If you have better information, you should have less risk and be in a position to make better decisions for your hundreds of thousands of dollars.
Your home is the single largest investment you'll make - trust it with an accountant.







Post a comment