

Recapping the year to date, January and February started out hot. March was a tale of two halves, with the first half continuing hot, and then the brakes coming on in the second half after all three levels of government started implementing emergency measures to help contain the spread of COVID-19. Then April was one long month of riding the brakes. GTA-wide transactions went from about 9,000 last year to just under 3,000 this year - the lowest April in the last 25 years (as far back as TRREB supplies monthly numbers for).
A pause to tell you the full set of market charts (only excerpts are highlighted below) are always available here on my website. Let's dive into some of the April numbers...

Transaction numbers were quite something
Like a lot of charts, the sales one took a right turn in the month.
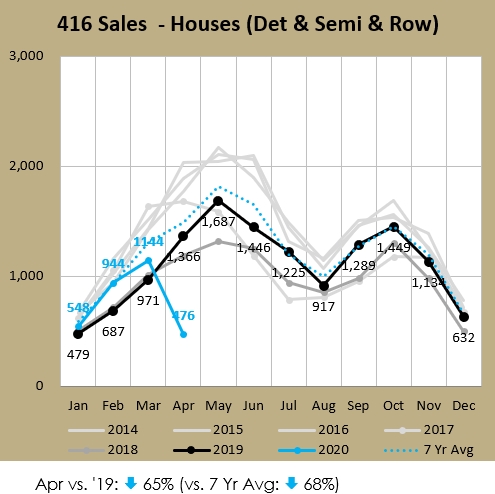
You can see that numbers were 65% below the prior year's April sales. This broke a streak of 12 months where year over year (YoY) volumes were up in double-digits. I mentioned the year started off hot. At the end of March, year-to-date (YTD) sales for 416 Freeholds were 23% higher than 2019. Well, after April that's now 11% lower. This was the lowest April volume in at least 25 years - by a margin of 60%!
Condos were even worse, down 70% versus last year. As you see below, in every region of the GTA, condo apartment sales dropped the most of any housing type. (Condo apts are 90% of total condo sales, with condo townhouses the remaining 10%.) The YTD sales for condos went from up 14% at the end of March to down 14% at the end of April. Total reversal in direction.
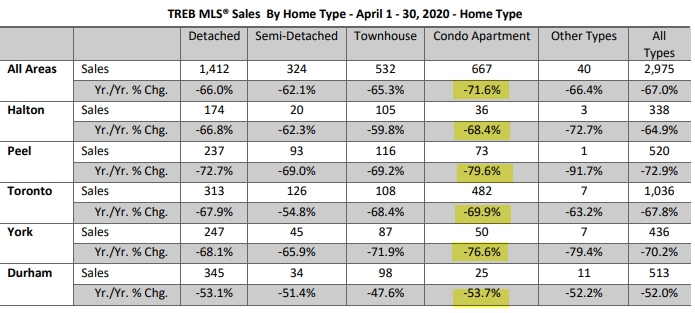
It ended a streak of 9 months in a row where YoY sales increased. This was the lowest April volume in at least 25 years, by a margin of 23%. This margin is lower than the freehold margin because there weren't as many condos around in 1996.
MOI points the way
Months of Inventory (MOI) is one of my favourite statistics, as it shows the relationship between demand (sales) and supply (active listings). The number tells us how long it would take to sell the existing inventory, given the current pace of sales. So the formula is active listings (snapshot at the end of the month) divided by sales (transactions in the last month). If it would take 10 months to sell off all the listings, that's a strong buyer's market (as the buyer's have leverage and can negotiate prices downward). If there was only 1 month of inventory then that's a strong seller's market and that's when you'll find a lot of bidding wars with multiple buyers competing on the same property, driving prices up quickly.
Many people think a balanced market is at around 5 months, so 4-6 is considered balanced territory. Under that is a seller's market, over that is a buyer's market. Some observers think each city has it's own numbers. I've seen some saying that the GTA's balance point is lower, like 3 months. In any event, as you can see below, we were in a seller's market in February and March.
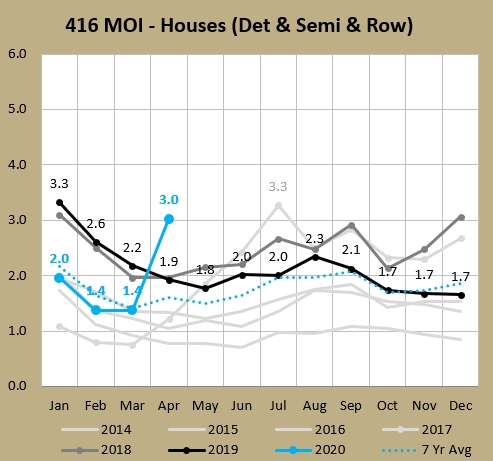
Note how sharp the rise was in the month, climbing from 1.4 to 3.0. That 1.6 gain is very significant for one month. The last time we had a sharp rise in MOI was in the spring of 2017 after the foreign buyer's tax and other cooling measures were introduced by the Ontario government. But that rise (peaking at the 3.3 you see above) was 2.5 over 4 months. So again, an increase of 1.6 in one month is significant.
At this point I also want to note that MOI can and are different at different price points, areas, and with housing types. Here are the underlying MOI numbers for the housing types underlying April's 3.0 MOI number for freeholds:
- Detached 3.7
- Semi-detached 1.5
- Rowhouse 2.6
And looking at each and every of the 11 East TRREB zones (E01, E02, etc.), all of them had an MOI under 2.0 last month. Those areas are more affordable and there are so many buyers trying to get in at entry-level pricing that the demand is still strong in those areas.
Low MOI (i.e. a tight market) generally accompanies big price appreciation. At March 2017 when the freehold MOI was at 0.8, YoY price appreciation was 33%. In 6 months, the gain was 24%. The other thing to keep in mind (as I've mentioned several times before so forgive me if it's a repeat to you) is that it's not just the absolute MOI number that is important, but also the magnitude and rate of change. Case in point, the spring of 2017:
Now average prices can distort things (on the way up or down), becaue the underlying mix can make a big difference. But note that the period of the prices falling - it's a 4 month decline from April to August. And when did MOI rise? The 4 month period from March to July.
You thought that freehold MOI jump was big? Well, here's the condo chart:
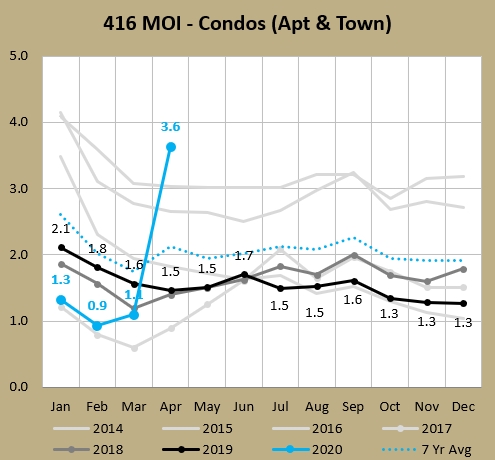
Because sales declined more in condos and active listings didn't fall as much, the jump in condo MOI (2.5 in the month) was higher than the freehold jump (1.5). It's also larger than the entire increase seen in 2017, where it went from a low of 0.6 in March to a high of 2.1 in July (1.5 over 4 months). So condos just jumped more in one month than they did over the whole softening period in 2017. It also became the first month that condo MOI was higher than freehold MOI in 37 months. That was a rare thing before (it had only happend 19 times in the 254 months before March 2017). The 3.6 for April was also rare for being over 2.0, because it had been below that mark most of the last 4 years (47 of 49 months).
So we've talked about how high MOI and/or rapidly rising MOI can point towards falling prices. Let's switch back to freeholds for a moment as you look at the different components below:
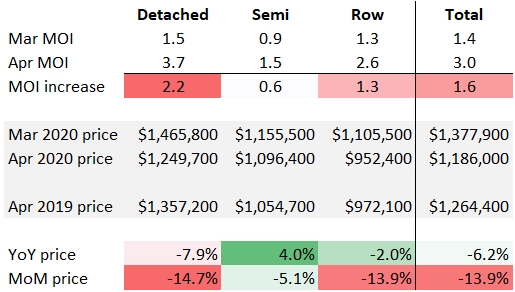
Note that the worst increase in MOI (Detached) also had the worst increase in the YoY average price and the MoM average price. And that the one with the lowest increase in MOI (Semi) also fared best when looking at YoY and MoM average prices. That's exactly what I'm talking about. Speaking of prices...
Prices showing some mixed signals
First let's look at 416 condo average prices.
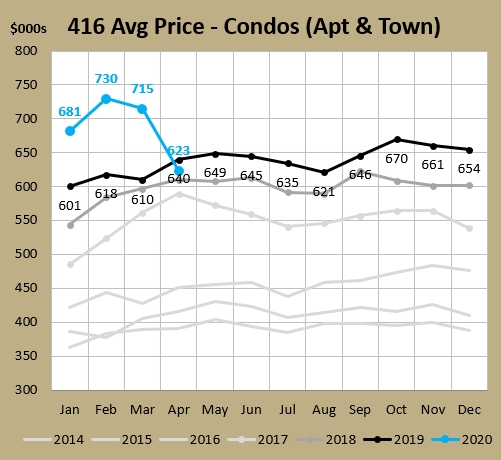
That's the first negative YoY decline since February 2015, ending a streak of 61 straight months. Even the 2017 spring slowdown didn't cool the condo market this much. And we are possibly only getting started. However, maybe by now the "investors" that were running Airbnb ghost hotels and saw their incomes drop to zero have all listed and sold (or switched to the long-term rental market), meaning perhaps a lot of the pressured sales have alredy happened. The average condo apartment was down $100K and the average condo townhouse was down $30K in the month, with their average being down $92K. I did calculate that the share of condo sales that that were $1 million and over were 6.7% in March, but less than half that share in April (3.3%). So that's going to drag down the average.
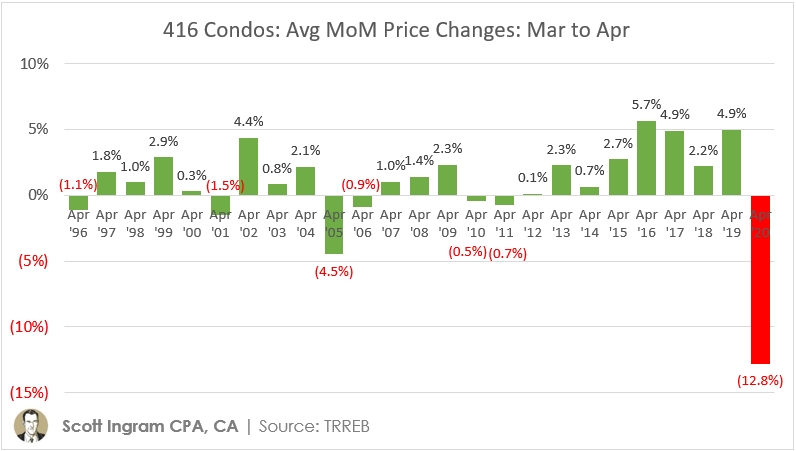
I'm not saying condos did well last month. You can see that prices usually increase from March to April (average of +1.0%). This was the first time since 2011 that average condo prices dropped from March to April, and only the 7th time in 25 years. And the magnitude was in a league of its own.
But (and here's where the "mixed" part comes in) if you look at the Home Price Index it tells a different story:
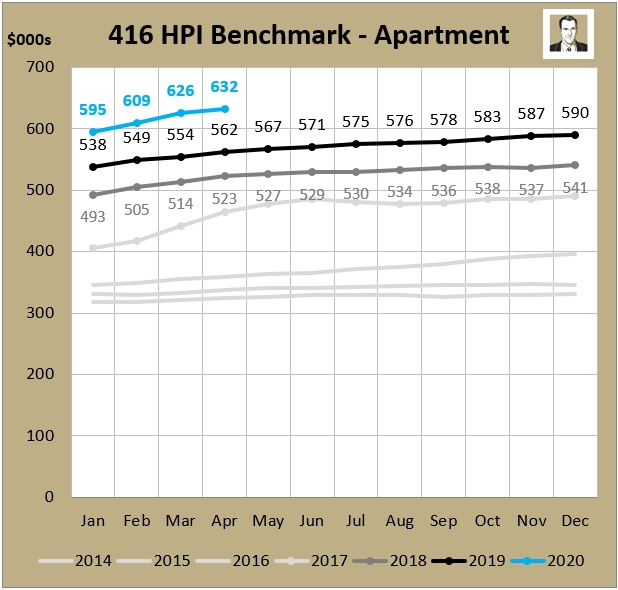
It shows benchmark prices actually increasing from March to April (though they - it's calculated by CREA - had the YoY increase slowing from 12.9% to 12.5%). Here is some background on the HPI, but basically it throws out the extreme high and low-end places and tracks a "typical" property. Kind of like how in figure skating they used to throw out the highest and lowest judge scores. So it's a bit of a smoother line than average prices, which are subject to the whims of mix (composition) from month to month - and even year over year. So a $2 million condo apartment may fetch less right now - which is why the high-end places usually get pulled from the market first because if you don't need to sell your high-end condo now, why would you? And maybe lower-priced studio and one bedroom condos that were former Airbnb rentals that were rushed to market in a panic are getting less. And those would drag down the average. But the benchmark or "typical" condo apartment didn't go down in April according to CREA's calculations.
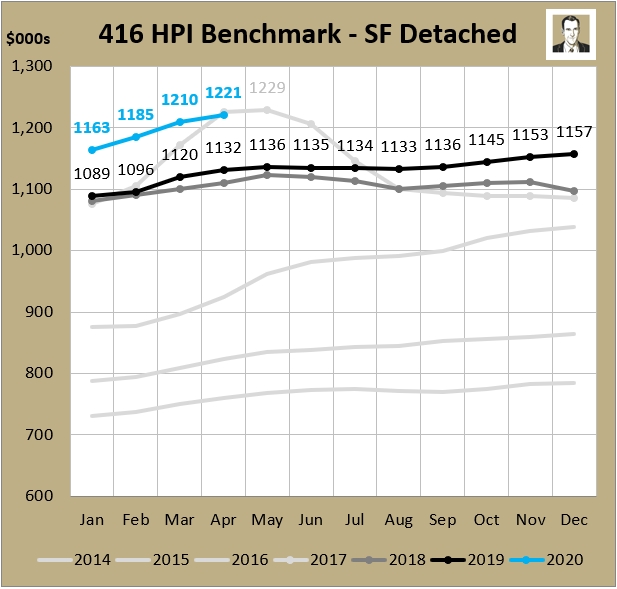
Let's shift gears to detached, or single-family detached as they call it with the HPI. We saw above that the average 416 detached fell 13.9% from March to April. HPI? Has the benchmark price increasing $11K, or 0.9%. 
Some of this is because less high-end stuff is selling, similar to condo apartments (but not as extreme). Properties >$2 million were 6.0% of GTA sales in March and fell to 4.6% in April. In the 416 the average of the March $2M properties was $2,973K and in April it was $2,750K. Those things would bring down the average, but because they're towards the extreme, what's happening with expensive properties doesn't affect the benchmark properties. If we look at the mix of Houses above, detached ($1,250K in April) was 73% of Houses sales in March, falling to 66% in April. Semis ($1,096K) rose from 20% in March to 26%, and Rowhouses ($952K) grew from 7% share to 8%. So swapping out less of the most expensive one for more of the less expensive ones is also going to lower your average price.
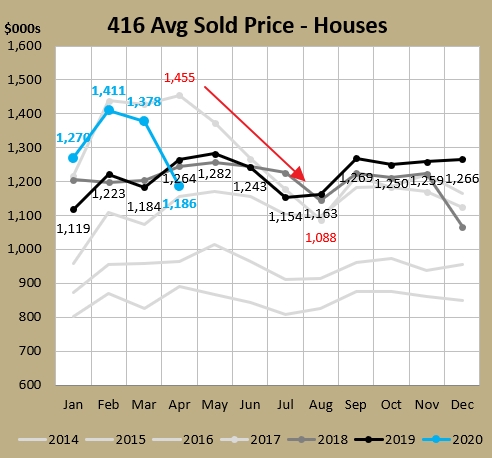
But sometimes the average price acts as a leading indicator for the HPI. In 2017 the average price started declining in May (sharply) from 3 months over $1.4M, went down for 4 months bottoming out in August below $1.1M, and then moved to bounce around the $1.2M mark about 2 years, then went to mid $1.2M for a few months before shooting up at the beginning of 2020. In contrast, the HPI started declining a month later, then slowly eased it's way down from its high of $1,229K to eventually bottom at $1,081K 8 months later. Then it slowly has worked its way back up over 27 months to hit $1,221K (just shy of 2017 peak) last month.
So there wasn't much "good news" with prices in April (if good news to you means it's going up), but I'm saying it might not be as severe as the headlines make it out to be.
What will May bring?
Well, I don't think April showers will bring May flowers. It will be interesting to see if the HPI begins to fall in May. It wouldn't surprise me.
But looking at a bunch of statistics on a weekly basis, I have seen signs of stabilization in the past few weeks. These things aren't always linear, and maybe things are resting before falling again. Even if the market gets a bit better during May I fully expect to see record monthly sales.
It's going to take a while for the economy to return (and our lives, for that matter). So I don't expect we'll be seeing heated conditions with 20+ offers anytime soon (although). I can see sellers wanting to return before buyers. But then again, with sellers pretty much always going to sell before buying for a while longer, maybe they'll hold off on listing if they don't see much inventory to choose from (freeholds had 45% less inventory at the end of April than the seven-year average, condos had 69% less). Nobody wants to be stuck without a place, or wants to move twice (if they have to rent for a year). And if we get into a falling prices scenario, buyers will prefer shorter closes to minimize the risk of it not appraising at the value they paid for it. So that makes it harder on sell-first sellers too. So there could be a chicken-egg listings stalemate that happens.
Or not. Everyone's just guessing at this point. And guesses are less educated because so much of this situation is unprecedented.
Again, the full set of charts are available here. Stay tuned and stay well!
About Scott Ingram CPA, CA, MBA
Would you like to make better-informed real estate decisions? I believe knowledge is power. For that reason I invest a lot of time researching and analyzing data and trends in the Toronto real estate market. My Chartered Accountant (CPA, CA) side also compels me to perform a lot more due diligence on properties my clients are interested in purchasing. If you have better information, you should have less risk and be in a position to make better decisions for your hundreds of thousands of dollars.
Your home is the single largest investment you'll make - trust it with an accountant.
Post a comment