

Carrying on the narrative from last month, and the last several really, condos are still having a rough go of things, and freeholds are not.
You'll find the full set of market charts (only excerpts are highlighted below) here on my website. Let's get at November...

Freeholds are all caught up - and then some
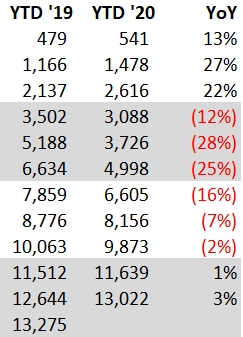
After the big 416 freehold sales hole from April (-65% YoY) and May (-62%) and even June (-12%), I would never have thought we'd be able to dig out this year. The sales transaction deficit bottomed out at the end of June, with sales 1,634 behind 2019, 25% lower. And now we're sitting we're now sitting 378 sales above where we were at the end of November last year. That's a swing of over 2,000 sales. It's still behind behind the average of the last 10 years by 12%, but it was quite a comeback.
Condos still weakening
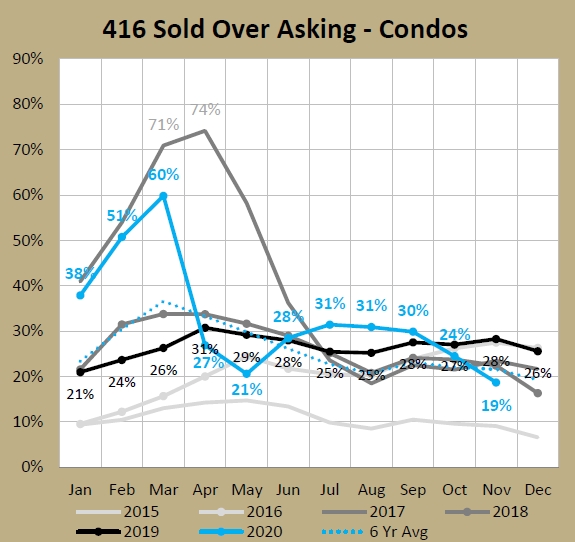
Nothing new here, just that it keeps continuing. Finally, one of the last indicators to look worse has crossed over. Just two months ago, 30% of 416 condos (apartments and townhomes) were selling for over asking, which was the highest September in the last 6 years (which is safe to say is the highest ever since this method of selling is a fairly recent phenomena - especially in the condo segment). Now, two months later and it's 19% which is lower than any recent year except 2015, before this pricing strategy really took a foothold.
Where 416 freeholds dug their sales volumes out from a low of -28% YTD to be sitting at up 3% YTD, 416 condos bottomed out at -26% YTD at the end of May. They have clawed back, but still sit 10% lower than YTD November in 2019, a difference of over 1,700 sales.
While sales have been slowing, inventory has been climbing and climbing, sitting at 5,401 active listings at the end of November. That's a new November record by over 300 (5,087 in November 2008).
The combination of slower sales and higher inventory has led to a high Months of Inventory (MOI). It has improved since the 3.6 in October, but the current 3.3 is the highest November since 2013 (3.4).
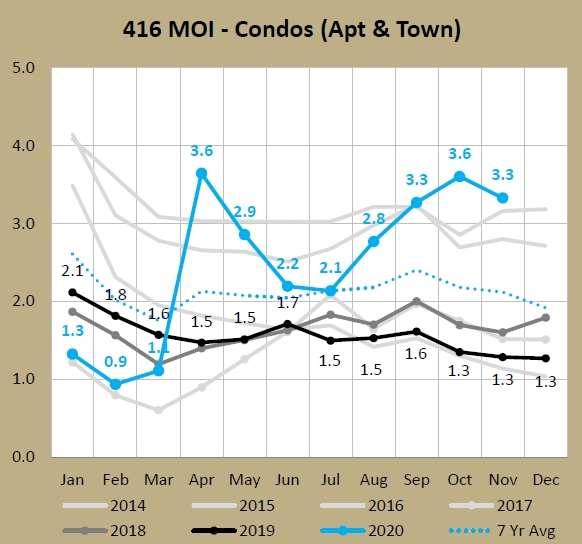
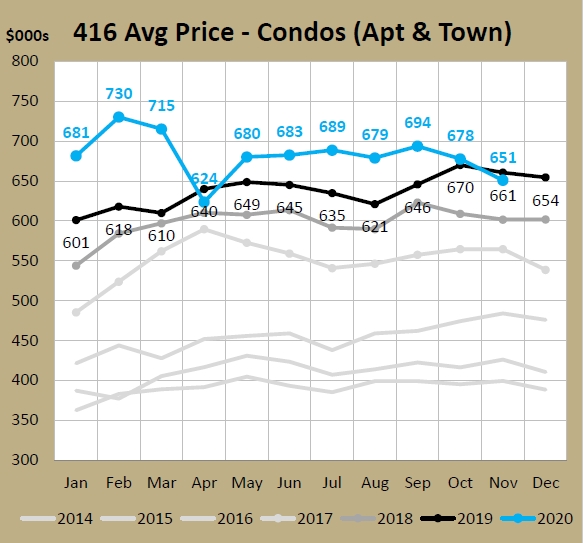
People tend to have short memories for this kind of things, so while it's cooled off from how hot it was in the last few years, it's actually not as wild historically as you may think. The average November for the five years of 2011 to 2015 was 3.3. And prices were still rising then. But let's talk more about pricing. There were a couple of interesting notes from November. The first is that the average price was lower than it was a year ago (by 1.5%). I'm going to ignore April because that was a weird anomoly, so other than that, this was the first negative YoY month since February 2015. That's a long run.
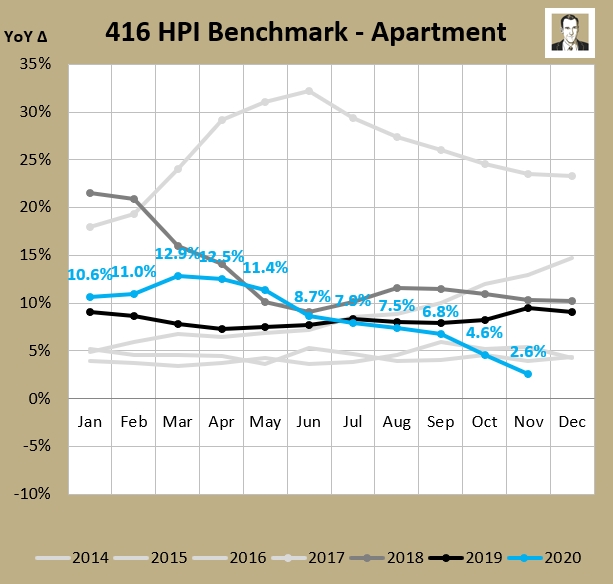
The other thing that I found interesting was that the Home Price Index (HPI) for condo apartments (the above includes condo townhouses, but apts are about 90%) continued to decline. From a peak of $634K in May, it's not sitting at $604K, about a 5% decline since peak for the "benchmark" condo apt. But note it is still higher than it ended last year at ($590K) or was in January ($595K). So it's hardly a bloodbath. But because the benchmark price has declined and last year was strong, the YoY increase is sitting at 2.6% now. Since they started the HPI in early 2012, this is the lowest YoY increase in the benchmark for condo apartments. I mean it's still positive, so again, not a great tragedy, but just pointing it out.
So about that "freeholds out of hand" thing?
One of the things I track is the ratio of Detached prices to that of Condo Apts. Detached is about 70% of 416 freeholds and Apartments are about 90% of 416 condos so they're about 80% of sales transactions. And many people use condos to enter the market and get on the "property ladder," then trade up to a detached home once they've built up some equity. So it's interesting to track the relation.
I've tracked it back to January 1996, when the ratio was 2.00. That is, the average price of a detached home ($268K) was 2 times more than the average price of a condo apartment ($134K). Prices have obviously moved a lot since then, but this ratio has more or less held near there. In the 299 months, the median number is 2.06 and the average has been 2.13. If you looked at the ends of the distribution curve, it's only dropped below 1.9 about 10% of the time (32 occasions), and only popped above 2.5 about 10% of the time (30 times). It has been above 2.25 67 times (22%), and nearly 2/3 of those were concentrated in 2014 to 2017 (43 of the 67).
Well look what has popped above 2.25 again:
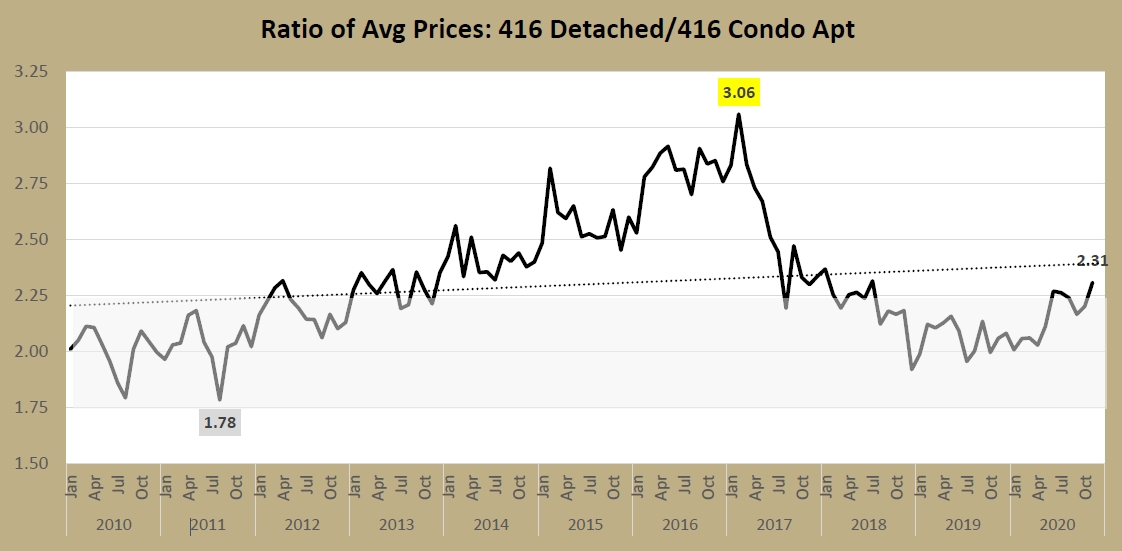
I'll be the first to say that where I've drawn the shaded target area for this ratio is very arbitrary. I took the nice and round and simple number of 2 and padded it by 0.25 on either side to make 1.75 to 2.25. Turns out 232 of 299 months have stayed within these parameters (78%). But it seems like whenever this ratio strays too far, it falls back in line. My theory is that once freeholds become too far ahead of condo prices (ratio gets hight), people can't trade up anymore and the freehold market stalls. And if condo prices get too high (shrinking the ratio) then trading up becomes attractive, or people that are jumping into the market will just pony up the difference to get into a detached and skip the condo step on the ladder. It would be nice to have more hard data around what share of people buying detached are indeed moving up (from condo apartments, and from attached housing), and what share are just jumping in. But the theory seems to work on an intuitive level (at least for me!).
Note the 25-year peak of 3.06 in February 2017. You may recall detached houses were having a huge run-up in early 2017 before the Ontario Fair Housing Plan came along in April and doused the flames. Then detached prices came back to earth a little, but condo apartments remained strong for a few years. Now, after the market started moving again after the initial COVID shutdowns, freeholds have been on fire and as we saw above, condo prices have come off, making this ratio grow again. At some point, condos are that much cheaper and people start buying them again, their prices rise again, and the ratio drifts back to it's normal range. Or at some point detached, which has its benchmark up 10.1% up YoY, will become too far out of reach and people go back to the more affordable condos.
This 2.31 may continue to rise, but I caution that if it gets up in the high twos, I'd say a period of adjustment is looming.
Again, the full set of charts are available here. Stay tuned and stay well.
About Scott Ingram CPA, CA, MBA
Would you like to make better-informed real estate decisions? I believe knowledge is power. For that reason I invest a lot of time researching and analyzing data and trends in the Toronto real estate market. My Chartered Accountant (CPA, CA) side also compels me to perform a lot more due diligence on properties my clients are interested in purchasing. If you have better information, you should have less risk and be in a position to make better decisions for your hundreds of thousands of dollars.
Your home is the single largest investment you'll make - trust it with an accountant.
Post a comment