

Every month recently has been a lot different than the prior. In February things were hot. March was a tale of two halves, with the first half continuing hot, and then the brakes coming on in the second half after all three levels of government started implementing COVID-19 measures. Then April was one long month of riding the brakes, with 2,975 GTA sales representing the lowest April in the last 25 years (as far back as TRREB supplies monthly numbers for). May was a bit of bounceback month (GTA sales climbed to 4,606), but it's a long road back to normalcy (those sales were 54% lower than May 2019).
You'll find the full set of market charts (only excerpts are highlighted below) here on my website. Let's get at it...

Everybody loves prices
I have been tracking a lot of things weekly, on Twitter, during COVID-19. One thing I haven't been tracking is prices, though I often get asked "What about prices?" That's because sample sizes in a week are too small (in my opinion) to be meaningful. Volumes, sure. But prices really depend on the underlying mix of homes, and that could easily shift from day to day and week to week. But let's look at prices now., first for 416 Freeholds.
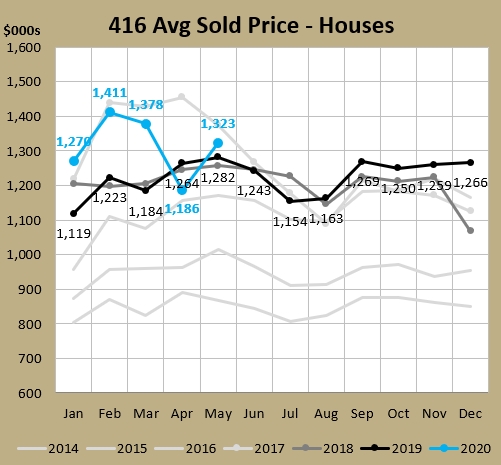
In April, it was "OMG prices fell 13.9% in a month," to be lower than any April since 2016. The sky is falling! And in May it's suddenly, "OMG prices rose 11.6% in a month" to be ahead of all years but the ealry 2017 few month bubble. The truth lies somewhere in between. Let's look at the Home Price Inde (HPI) which leaves out homes at the extremes (10 room mansions, 1 bedroom shacks) and instead tracks the values of "benchmark" homes which are made of of attributes most common in the area.
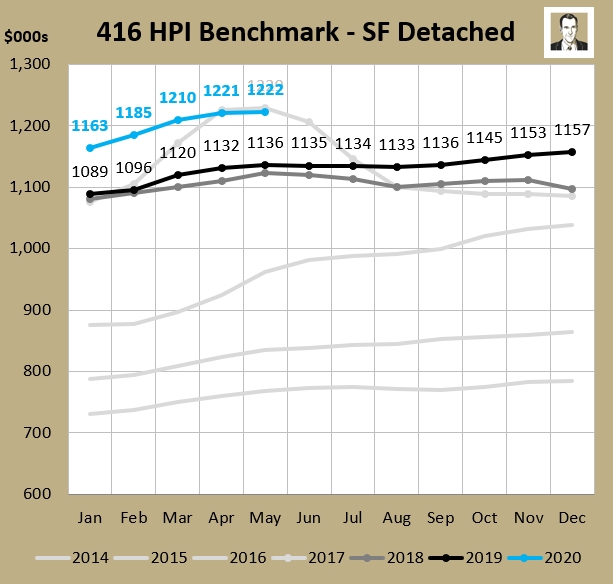
I chose single family detached (SFD) because it represents about 70% of 416 freehold sales. You can see by this measure, prices have been pretty steady in the last 3 months - within 1%. This measure removes a lot of the swings in composition (housing types and price points). This is not to say that high-end homes didn't sell for less in April (or May) than they would've in February. But it's showing there's a lot underlying the AVERAGE prices you see in the newspapers monthly.
It was a very similar story in 416 condos.
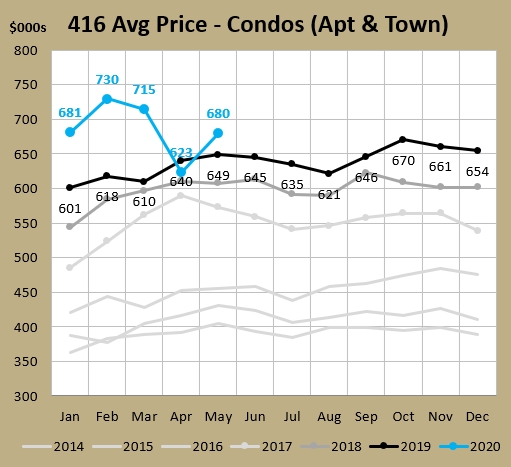
The average price fell 12.8% from March to April, and then rose 9.1% in May. April was the first time in 61 months (February 2015) that that the year-over-year (YoY) average price was lower than the year before. But in May we're back up and $31K clear of 2019 so things look more normal. Take a look at the share of million-dollar condo sales in the last 3 months:
March: 6.7%
April: 3.3%
May: 6.1%
Can you spot the outlier? To me, April prices were a bit of an anomoly. I'm not saying prices won't decrease in coming months - when you consider the factors that may shift the demand curve, they all seem more likely to decrease demand. But there hasn't been that much movement yet.
MOI points the way
Months of Inventory (MOI) is one of my favourite statistics, and I wrote why in my April stats post. A high MOI (buyer's market) or a rapidly increasing MOI signals that prices are likely to fall. A low MOI (seller's market) or a rapidly decreasing MOI (market getting tighter) signals that prices are likely to climb.
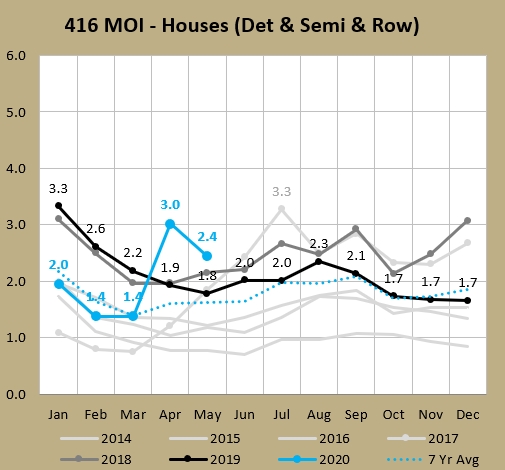
And if you recall the price charts above, they did move rapidly in the inverse direction of the MOI changes. Freehold MOI was sitting at 2.4 at the end of May, which isn't too far off the 2.2 average of the last 25 years.
I want you to note that there are a lot of sub-markets underlying these average MOI numbers and they can and do act differently. For example, the MOI across the entire TRREB region (roughly the GTA) was 2.5 (all housing types). Looking just at Halton Region it was 2.3, but within Halton it ranged from 1.5 in Milton to 3.5 in Oakville. In the City of Toronto it was 2.7, and that broke down to 2.9 for condos and the 2.4 for freeholds that you see above.
Another sub-market would be the housing type, so that 2.4 freehold number above is hardly uniform:
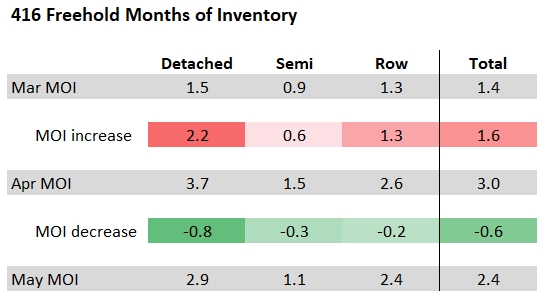
Note that detached (the most expensive type) is the highest here, and that semi-detached houses have stayed tight, even in April. The've all had the same directionl changes (up a lot in April, coming down in May), but detached has swung the mostly wildly and semis the least.
Speaking of more expensive and less expensive housing types...
Entry-level housing is doing just fine
There are so many buyers looking to break into the market and get on the property ladder that there's still a lot of sales happening at entry-level prices compared to the amount of inventory out there (MOI = active listings / sales). Take a look at what I've circled below, and note that anything under $1.25 million is still well in "seller's market" territory (considered to be anything less than 4 months of inventory).
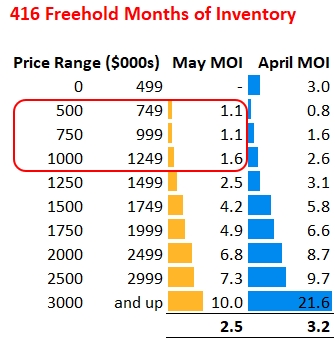
Also note that all of the figures improved from April to May, with bigger decreases at the highest price points (which had further to fall). So if you've been waiting to get into the market and are hoping for a big correction so prices will come back down to you, I'm sorry to report that it won't be happening in the near future in the places you're looking at. In the last week, first time buyer clients of mine who were looking in the east end were interested in three properties. Those places ended up having 3, 5, and 6 offers on them. That's definitely better than 7 or 10 that they may have received in early March, but it's hardly crickets.
The MOI softening does bode better for you if you're a trade-up buyer, looking at higher price ranges, though. (Note the 2.5 is slightly off from the 2.4 official number because I have to pull this manually so it's an unofficial number. I'll also mention that the official 2.4 was the highest May since 2008.)
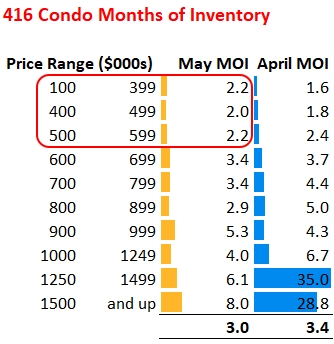
The same thing is holding true in the condo market, though the MOI numbers there are a bit higher. And most of the price points came down from April to May, especially the high ones.
What will June bring?
Heading into May I reported that "I have seen signs of stabilization in the past few weeks." Heading into June the trend has been more like signs of recovery. But that recovery has a long way to go, at least sales-wise. The sales transactions in the last two months were L-O-W.
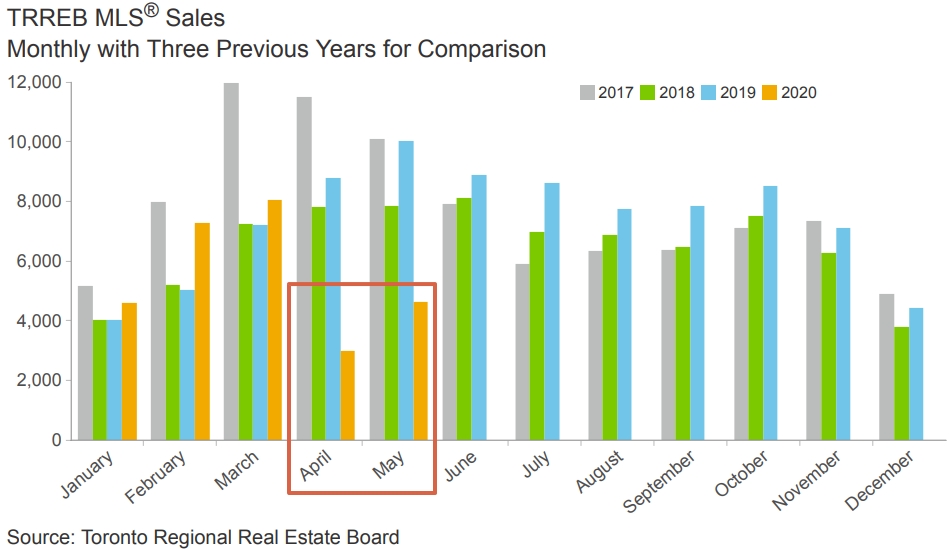
I had predicted a record low for May 416 sales (at least going back to 1996, which is what we have information for). That happened, and by a 34% margin. But it was better than April which was 54% clear of the 25-year low. For June, I see total sales growing versus May and it might not end up being the worst June ever - but it will still likely be the lowest sales in over 20 years.
But even with sales a lot lower than normal, as long as the market isn't suddenly flooded with listings and they rise at around the same pace as sales (i.e. MOI remains similar), the market is going to be kept in check.
Again, the full set of charts are available here. Stay tuned and stay well.
About Scott Ingram CPA, CA, MBA
Would you like to make better-informed real estate decisions? I believe knowledge is power. For that reason I invest a lot of time researching and analyzing data and trends in the Toronto real estate market. My Chartered Accountant (CPA, CA) side also compels me to perform a lot more due diligence on properties my clients are interested in purchasing. If you have better information, you should have less risk and be in a position to make better decisions for your hundreds of thousands of dollars.
Your home is the single largest investment you'll make - trust it with an accountant.
Post a comment