

A real split is developing in the freehold versus condo markets. We've seen them act differently before (which is why I run separate charts), but it's getting pretty extreme now. This year has been such a wild ride. In February things were hot. March was a tale of two halves, with the onset of COVID-19 mesures. Then April was one long month of riding the brakes, followed by the start of recovering in May and June as listings rose (as did sales). And then the normally sleepier months of July and August were making up for lost time, posting higher than normal sales due to "pent-up demand."
You'll find the full set of market charts (only excerpts are highlighted below) here on my website. Let's get at August...

Condo market really strong ![]()

On a sales basis, condos (apartments and townhouses combined) had a strong couple of months, with volumes up 12% year-over-year (YoY) in August, and 4% above the 7-year average.
Prices remain strong, with the YoY gain actually sliding up a bit from +8.5% in July to 9.4% in August.
Days on market (DOM) were an all-time low at only 18, 4 days lower than the previous low last year.
An August record of 31% of condos sold for over the asking price.
So those four stats seem to show a lot of strength in the condo market, yes?
Not wait, the condo apocolypse is coming ![]()

Those stats miss the biggest story in condos in the last few months, which has been the rise of active listings. You can see below how the first half the 2010s had much higher levels of condo inventory. Then beginning in February 2016 (red arrow) the listings started to diverge from the norms and had remained at very low levels since then. The year 2016 was a record year for GTA sales on the MLS (113K), which surpassed the previous record (101K in 2015) by nearly 12%. Real estate was hot, price gains were large, and lots of people thought they should become investors. So a lot of condos sold, people that would've normally sold their condos when they graduated up to a house decided to hold onto the condos too, and inventory got tight.
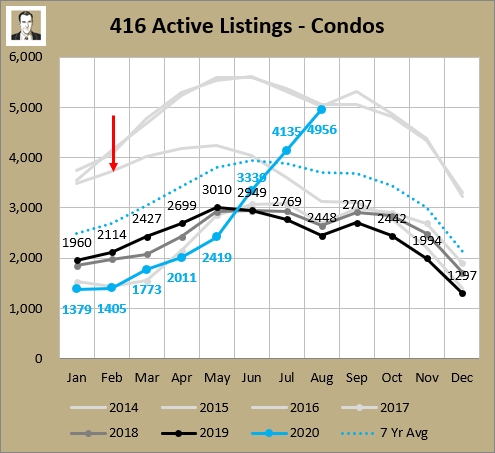
In the last 3 months we've seen a major rise in condo inventory. June was the first month in a year to exceed the listings inventory for the prior year. July was the first to exceed the 7-year average in a long time, and now August ended up back close to 2014 and 2015 levels. The 4,956 is actually little bit under the August average from 2012-2015, which was 4,992. But people seem to have short memories and the press loves a sensationalist angle so you're hearing "OMG, condo listings to the sky!" instead of "Condo listings are back to where they used to be" (no exclamation mark). Here are active listings at the end of August since 2003. Remember there were a lot less condos built back then and the population is a lot higher now, so you'd expect numbers to be higher now.
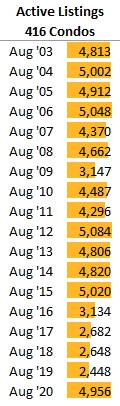
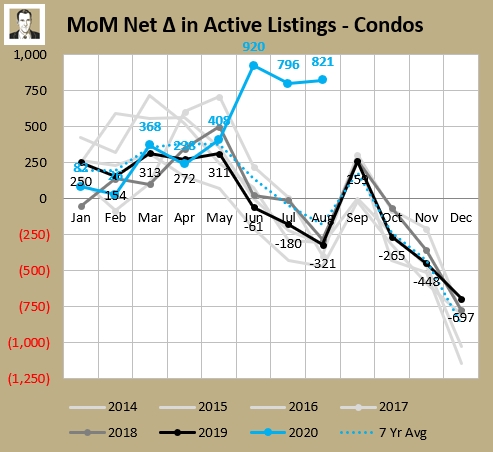
Looking at that, 2020 is not weird; the weird years are 2009 and the prior 4 years. I'll tell you what is weird, though: the amount of net listings that have been added the last 3 months. Normally in June, active listings don't change much from May (average net change in 7 years from 2013 to 2019 was +9). This year they grew by over 900 (MoM stands for month-over-month). You can active listings usually fall through July and August as things quiet down in the summer. This year there was a bit of a delayed spring, but still to grow by 800 a momth is extremely high growth for the month. For any month, actually.
So while I'm saying it's not too crazy for 416 condo active listings to be sitting around 5,000, when I track things weekly and they're still rising. The low listings have been what's been keeping price growth strong in this segment, so it stands to reason that this high amount of listings (relative to past few years) is going to knock the wind out of the sails of this market segment.
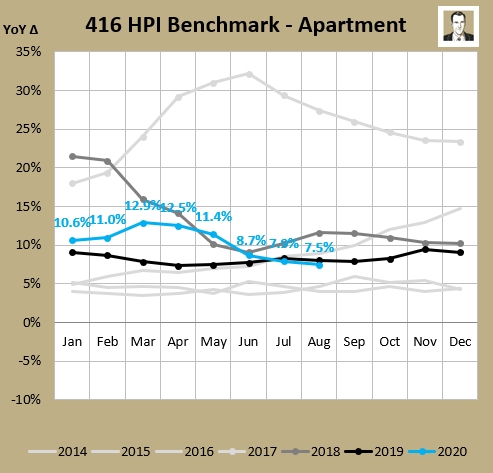
If you look at Home Price Index (HPI), which I do, you'll see the "benchmark" condo price has come off since its April-May highs:
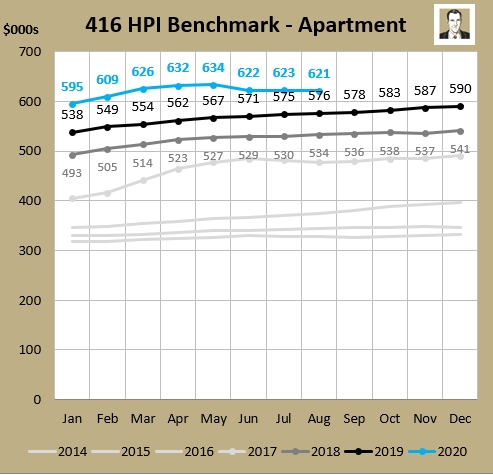
Price is still $45K higher than it was a year ago, but you can see that after reaching a 12.9% YoY increase in March, the price growth has decelerated for 5 straight months.
Anecdotally I'm seeing this softness too. When you've got inventory piling up in a building, things tend to move more slowly. People get impatient and some sellers will drop the price to get out ahead of the other listings. That may lead to a race to the bottom, like we're seeing play out in the rental market currently. Here's a good illustration of why the condo lease market is soft:
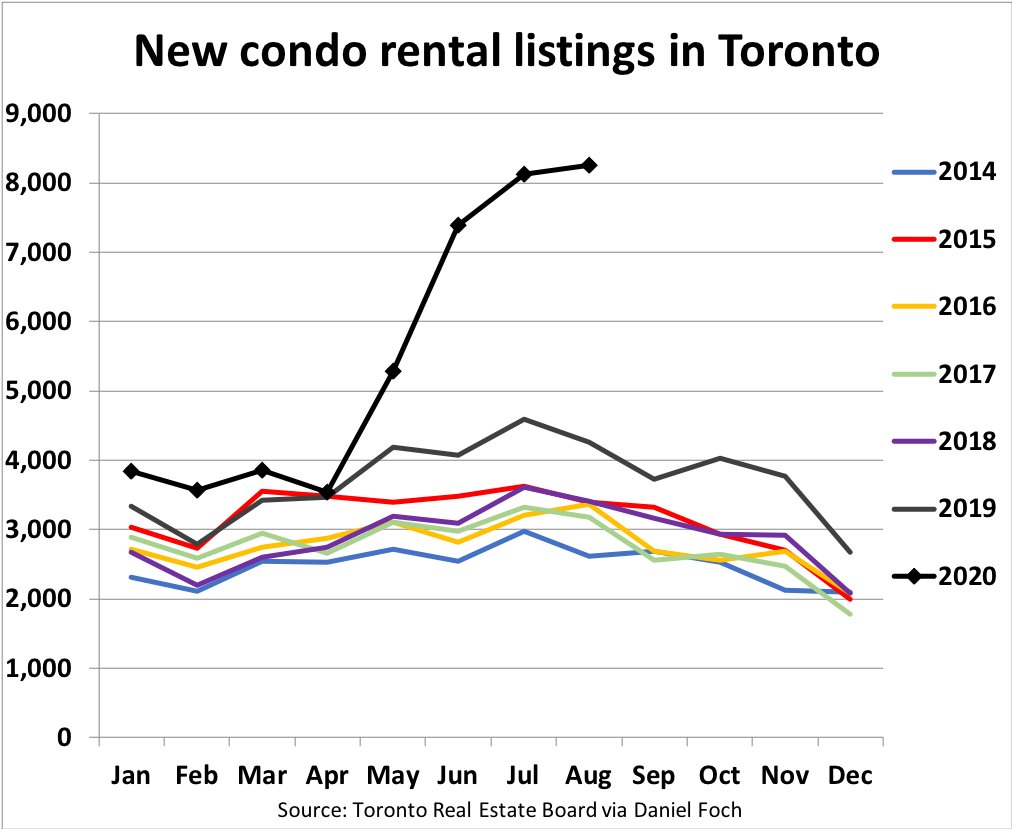
Chart via Ben Rabidoux on Twitter
Note those are "new listings" and not "active listings" like I've been showing, but you get the point: a lot of condos are coming on the market to lease. These are just the ones on the MLS too, which is just a slice of the condo rental pie (which includes Kijiji, Padmappert, etc.). So with lots of leasing competition and lease prices falling, I would think it's not an attractive time to become a landlord. So, to use some TRREB-ish language, "would-be landlords are taking to the sidelines" and demand to buy re-sale condos among that segment has got to be down currently. However there are still a bunch of end-users that have been waiting to get into the market so sales are not going to drop to zero.
Freehold market really strong (for real) ![]()
Here's the only chart you really need to see:
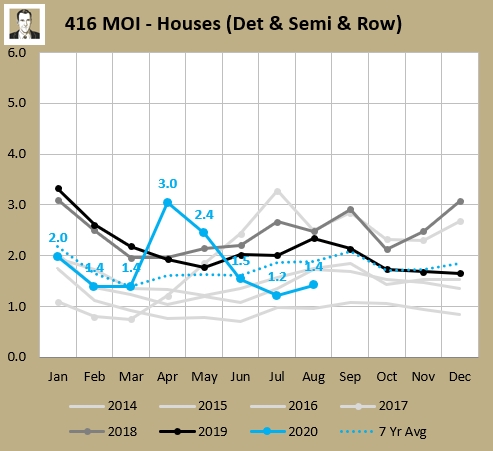
The months of invetory for houses is pretty deep into seller's market territory right now. In fact it's the second lowest August ever (behind only record-setting 2016).
Detached sales were up 65% YoY in August, while Semi-detached sales were up 81%. The average annual price gains were 21% for Detached and 22% for Semis. Even the more smoothed-out HPI shows noticeable price increases in the past couple of months, and all-time highs for detached and attached freeholds:
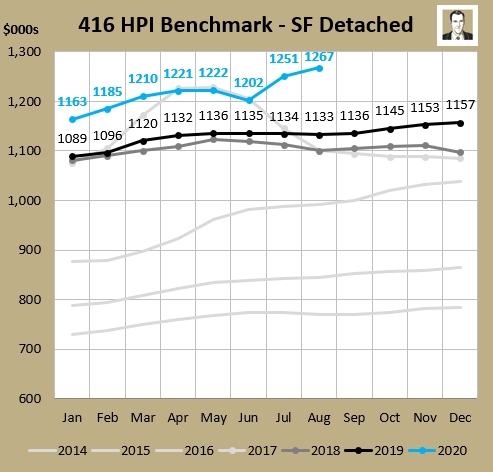
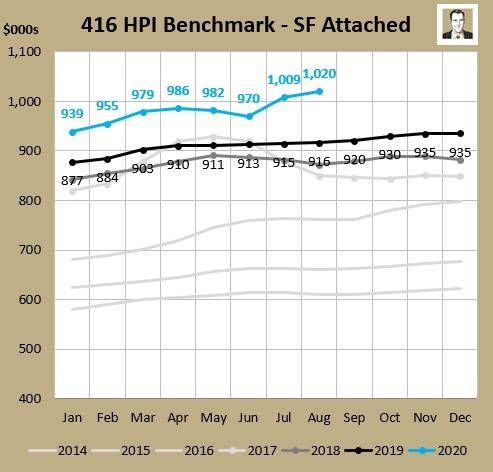
So not everyone is fleeing to the 'burbs, and demand for lowrise in the 416 is still quite strong.
What will September bring?
My guess is continued strong freehold sales, and further weakening in condo prices as listings continue to climb.
Again, the full set of charts are available here. Stay tuned and stay well.
About Scott Ingram CPA, CA, MBA
Would you like to make better-informed real estate decisions? I believe knowledge is power. For that reason I invest a lot of time researching and analyzing data and trends in the Toronto real estate market. My Chartered Accountant (CPA, CA) side also compels me to perform a lot more due diligence on properties my clients are interested in purchasing. If you have better information, you should have less risk and be in a position to make better decisions for your hundreds of thousands of dollars.
Your home is the single largest investment you'll make - trust it with an accountant.
Post a comment