

Every month recently has been a lot different than the prior. In February things were hot. March was a tale of two halves, with the first half continuing hot, and then the brakes coming on in the second half after all three levels of government started implementing COVID-19 measures. Then April was one long month of riding the brakes, with 2,975 GTA sales representing the lowest April in the last 25 years (as far back as TRREB supplies monthly numbers for). May was the start of recovering. and June just happened and it continued the trend of sucking less bad than the prior month.
You'll find the full set of market charts (only excerpts are highlighted below) here on my website. Let's get at it...

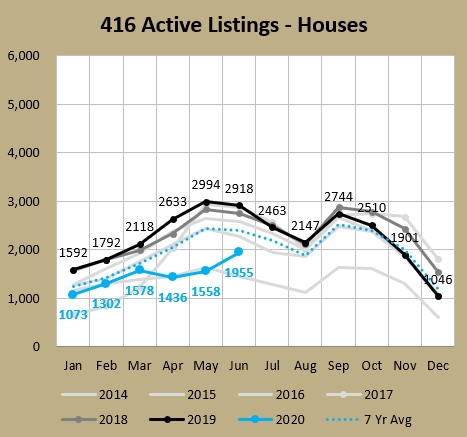
Active listings tell different story for houses and condos
One thing that really interested me last month was active listings. They climbed for houses and condos, as sellers continued to get more comfortable with having people through their homes.
But notice that active listings for houses (which grew by about 400 for the month, or 25%) are sitting 33% below where they were last year (black line)...
While condos (which grew by about 900 for the month, or 38%) are sitting 13% above where they were last year. And I can till you they've continued to steadily climb in July and will end up at the highest number since 2015.
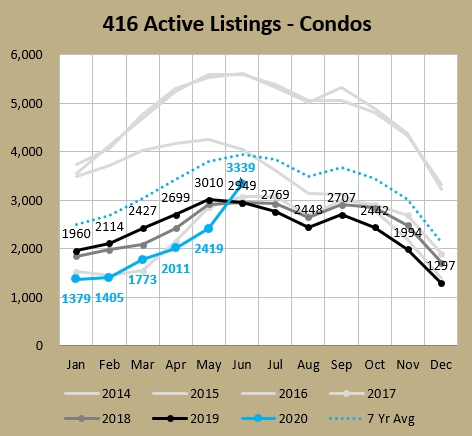
On one hand this is far above the 2016-2019 levels, but on the other hand the levels of the last few years have been extremely low historically for condos, so it could just be a return to more normal levels (which should bring price growth down to more normal levels as well, because that has been unsustainably high in recent years). In the last 5 calendar years (2016-2020), the average month has ended up at about 2,600 condos available for sale. The 5 years prior to that (2011-2015) that average was 4,600. This lack of inventory was really keeping the condo market bouyant.
Prices are wildin' - or are they?
TRREB's average price for June sales GTA-wide was $930,869 which was the highest month ever, beating April 2017's $920,791. So it took 38 months to get back to that high. And it's a helluva climb from April 2020's $821,292 (13.3% in two months!). But as I was saying on the way down, things weren't as bad as they looked on the drop due to mix (i.e. less of the expensive stuff, more of the cheaper stuff), and the same is true on the quick climb (sales of $1.5M properties and over are back on now).
By looking at average pices, we see this for freeholds.
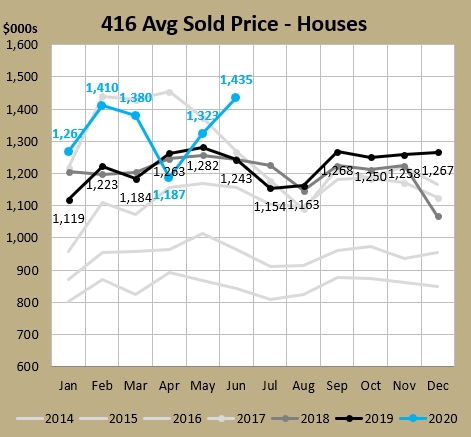
That $1,435K we just hit for average detached home prices in the 416 was the highest June ever and third highest month ever, behind April 2017 ($1,455K) and February 2017 ($1,439K).
For a look at prices with less noise baked-in, let's look at the Home Price Index. To know what the heck the HPI is about, I wrote an explanation here. Basically it stives to be a more apples-to-apples attempt at looking at prices by applying current prices to a consistent mix. Below is the HPI for Single Family Detached (SFD).
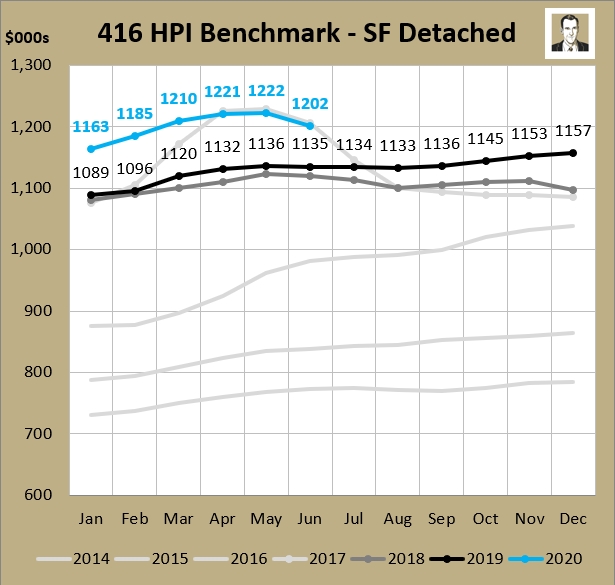
So instead of rising $113K in the month, prices were down by $20K. Now those two charts aren't quite the same as the "Houses" average price chart is detached and semi-detached and rowhouse freeholds all together. But detached houses are 70% of that, so they drove the increase (the average detached sold for $1,422K in May and $1,524K in June, an increase of $102K). So you had a different mix, with nearly 3 times more expensive houses selling in June (748 detached houses > $1/5M in the GTA, or 8.60% of all sales transactions) than in May (276 > $1.5M, or 5.99% of sales).
When average prices for detached houses dropped $70K from April to May in 2017 (and dropped $395K in the four months from April to August 2017), the HPI for detached lagged, not dropping until one month later (May to June), and by only $24K. The decline was much slower, with the first 4 months of drops totalling $135K (not $395K like the average). The decline was also longer, lasting 8 months (though the last 4 months only declined from $13K from $1,094K to $1,081K).
It will be interesting to see if more air will be let out of the HPI. Really prices have remained within 1.7% in the last 4 months, and note they are still well clear of last year (black line).
905 is tighter than 416
I've been readnig a lot of "people are leaving the city for the country" (or the suburbs) stories. There are several ways to look at this, and I'll share two numbers with you.
The first is that year-over-year sales for June were up 4.2% for the 905, yet they were down 11.3% for the 416.
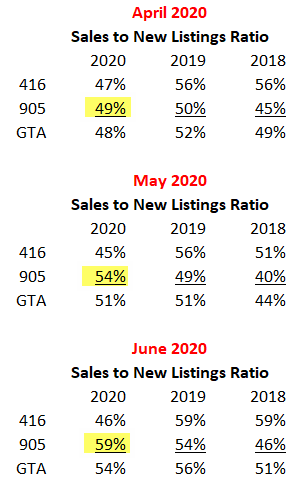
The second is below, showing how the SNLR (if it's high it means new listings are getting snapped up, therefore the market is tight) for the 416 (46% in June 2020) is lower than it was last year at this time (59%) and lower than April (47%). Meanwhile the 905 June figure has tightened from April to June (49% to 59%) and is higher than it was last year (54%).
So things appear hotter in 905 than 416. That could show that if people can work from home (WFH) they might want more space versus downtown amenities and entertainment. Or might show a flight from condos to lowrise housing. Or might not be proving anything, because this will take a long time to fully play out.
What will July bring?
Well, sales were a lot higher in June than I thought they'd be. And July is shaping up to be strong (for a summer month) with 416 freeholds up 28% in the first half of the month. And 416 condos? Well considering the last few months have been below 2019 levels, being slightly up in the first half is a bit of a win.
Again, the full set of charts are available here. Stay tuned and stay well.
About Scott Ingram CPA, CA, MBA
Would you like to make better-informed real estate decisions? I believe knowledge is power. For that reason I invest a lot of time researching and analyzing data and trends in the Toronto real estate market. My Chartered Accountant (CPA, CA) side also compels me to perform a lot more due diligence on properties my clients are interested in purchasing. If you have better information, you should have less risk and be in a position to make better decisions for your hundreds of thousands of dollars.
Your home is the single largest investment you'll make - trust it with an accountant.
Post a comment